---
title: "Graphical widget (Line Chart)"
slug: "line-graph-widget"
tags: ["Internal Line graph"]
updated: 2024-05-20T11:22:11Z
published: 2024-05-20T11:22:11Z
canonical: "help.symphonysummitai.com/line-graph-widget"
---
> ## Documentation Index
> Fetch the complete documentation index at: https://help.symphonysummitai.com/llms.txt
> Use this file to discover all available pages before exploring further.
# Line Graph
Line graphs are used to show trends or changes over time and are great for illustrating how data points evolve sequentially.
Let's explore the following Use Case for designing the Line Graph widget!
| **Use Case** **User Persona: Analyst** | **Solution** |
| --- | --- |
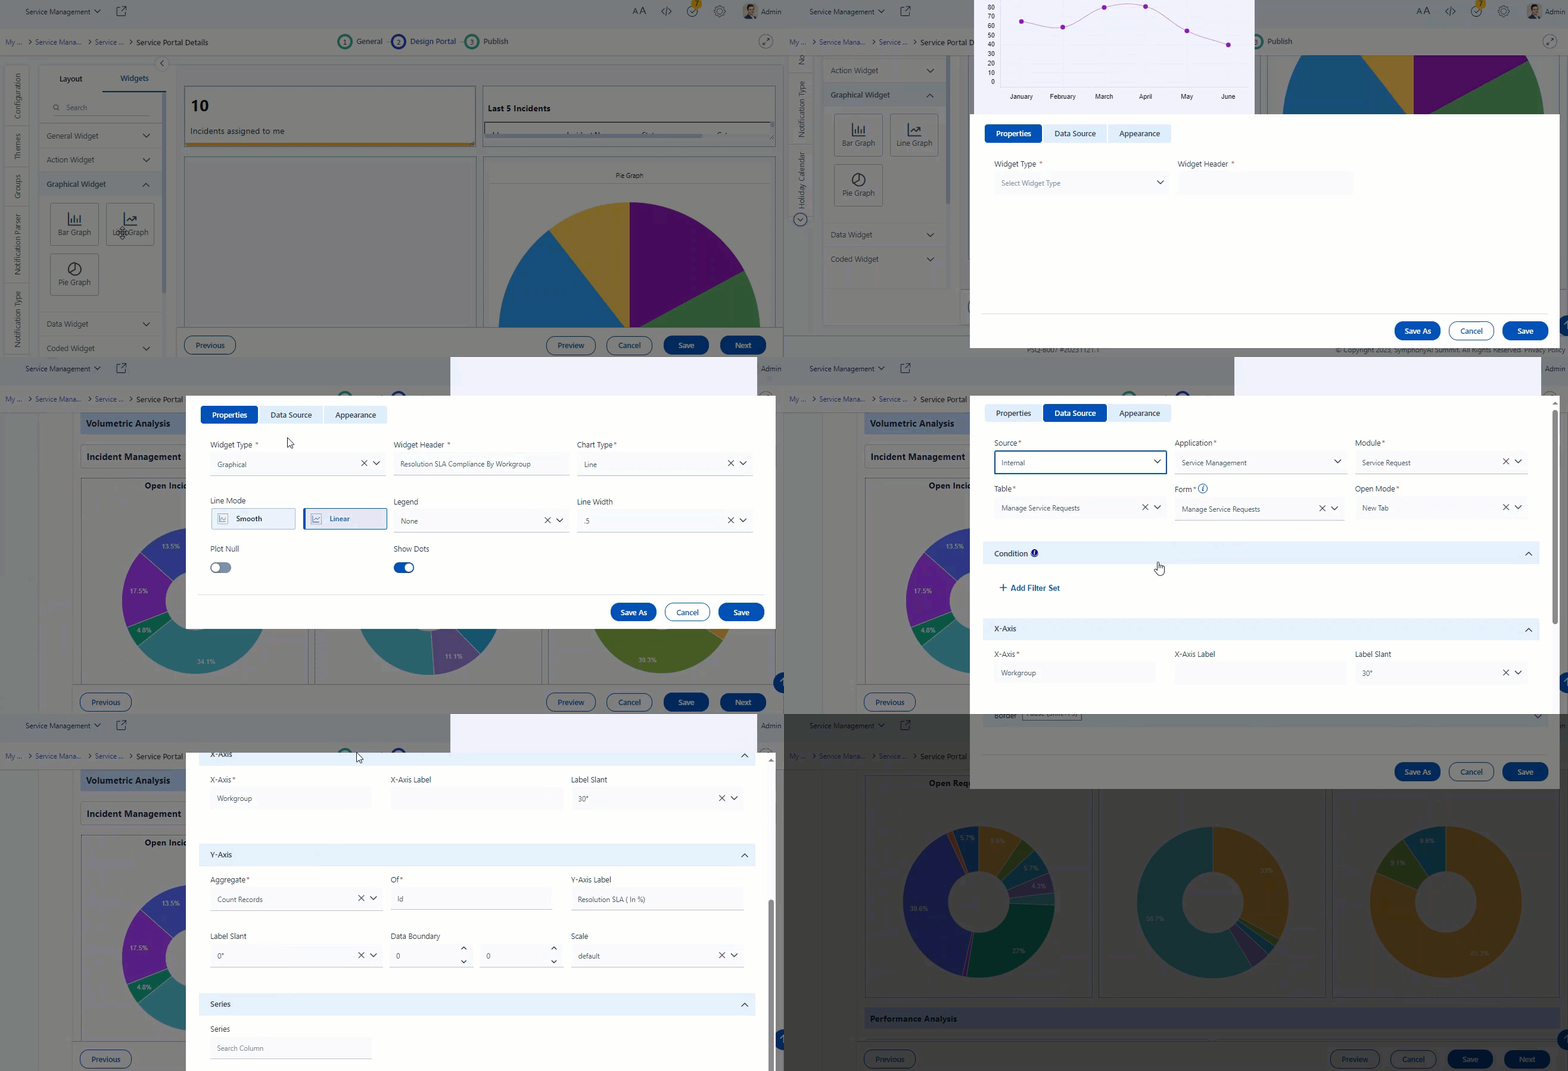
| Rosy, Analyst wants to get a view of SLA Compliance that she met while resolving the incidents over the period of the last four months. | Sam, the Application Designer select line graph widget and configure it to create trend analysis of SLA Compliance of resolved incidents. The analyst can view the data in the form of trend for past four months. |
Refer to the GIF for more details about the Use Case!
## Configure Line Graph widget
This section contains the list of steps using which {{variable.Role - Application Designer}} can add the widget in the Service Portal screen.
1. Navigate to **Design** **Service Portal** > **Widgets** > **Add Widget**.
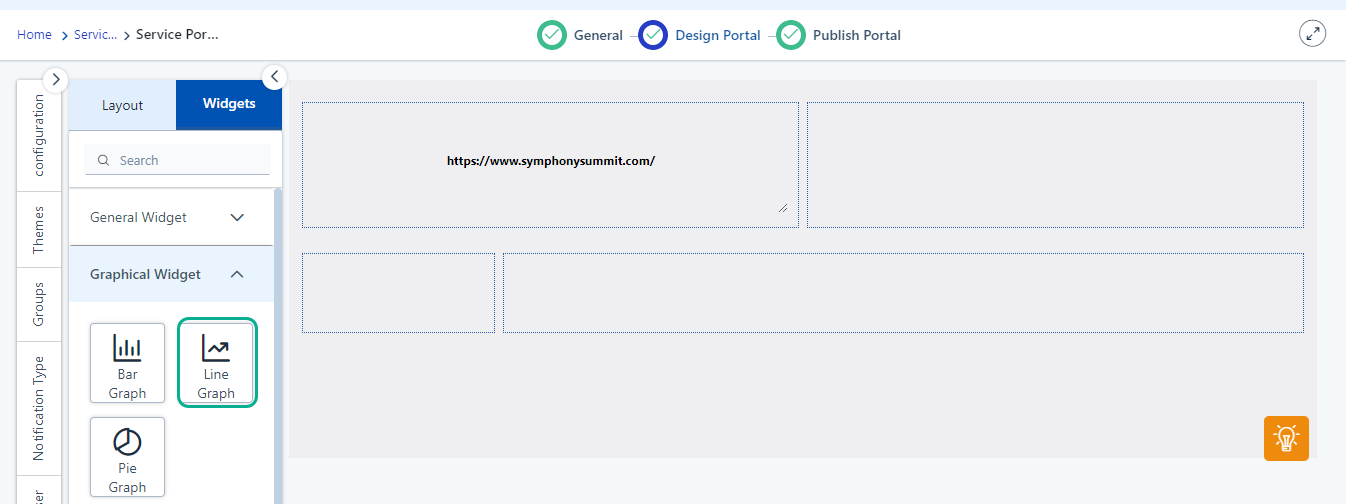 Figure: Adding Widgets
2. Customize the Service Portal by dragging the line graph widget from the widget list screen.Figure: Line Graph
3. Click (Settings) icon to view the Properties pop-up.
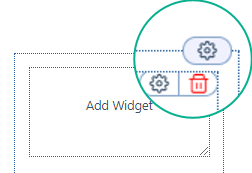Figure: Modify the clock properties
You can view the following tabs on the **Settings** for this field:
- [Properties](/summit-platform/docs/line-graph-widget#properties)
- [Data Source](/summit-platform/docs/line-graph-widget#data-source)
- [Appearance](/summit-platform/docs/line-graph-widget#appearance)[](/summitai-platform/docs/internal-line-graph-widget#code)
### Properties
The table below contains the list of fields and their descriptions that are available under the **Properties** section: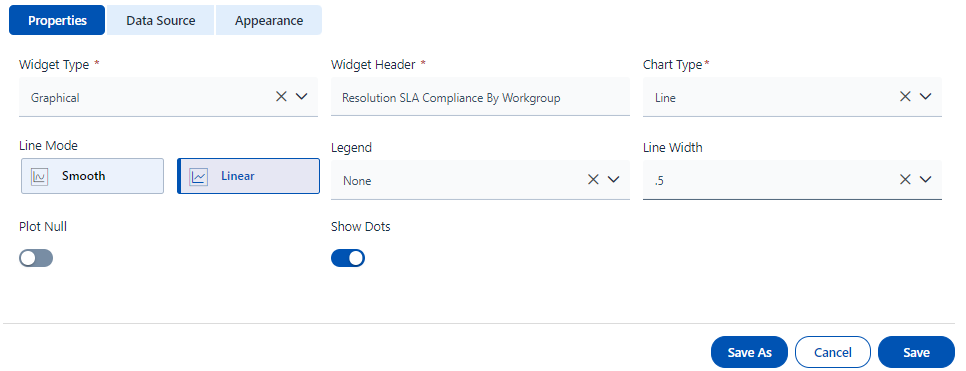
Figure: Properties tab
To know more about the fields that are available under the **Properties** section, see the Field Description given below.
**Field Description**
| Properties |
| --- |
| Widget Type | Select **Graphical widget** from the drop-down list. |
| Widget header | Type a name to the widget according to the Data to be configured in the widget title textbox. For example: Let us create a **Graphical** **Widget** to show the incidents assigned to me, so the widget can be titled **Resolution SLA Compliance By Workgroup**. 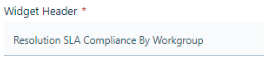 Figure: Widget Header |
| Chart Type | Select the **Chart Type** as Line from the drop-down list. 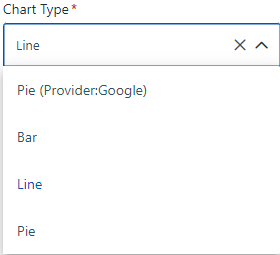Figure: Chart Type |
| Line Mode | Select **Smooth** or Linear depending based on your preferred visual presentation.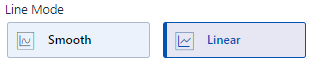Figure: Line Mode When **Smooth** is selected as **Line Mode**, the screenshot appears as shown below: 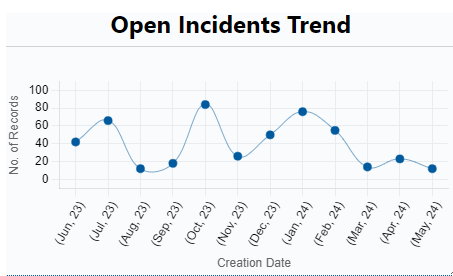Figure: Smooth line mode The screenshot below shows **Linear** selected as **Line Mode**. 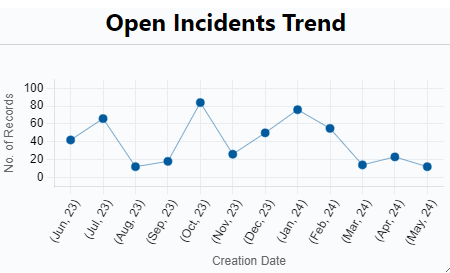Figure: Linear |
| Legend | Select the **Legend** position on the bar graph from the Legend drop-down list.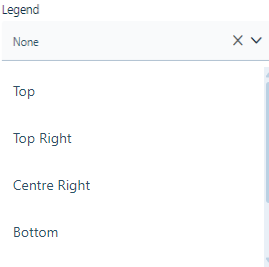Figure: Legend Common positions for the legend include: - Top Right: The legend is placed above the graph, usually centered or aligned with the graph's width. This position works well when there's enough space above the graph and when the legend isn't too long. - Bottom Right: Similar to the top position, but the legend is placed below the graph. This is useful when there's limited space above the graph or when the legend is too long to fit comfortably above it. - Right Side: The legend is positioned vertically along the right side of the graph. This is suitable when there's limited horizontal space but enough vertical space. - Left Side: The legend is positioned vertically along the left side of the graph. - Centre: Place the legend at the center to draw more attention to the graph. This is useful when you want to emphasize the relationship between the legend and the data. |
| Line Width | Select the **Line Width** for the line from the drop-down list. This property help to define the width of line on the graph. 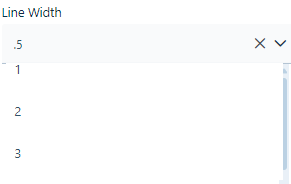Figure: Line width Line Width of 0.5: This is for a thin line graph. It is suitable for graphs where you have a lot of data points or lines and want to maintain clarity without using thick lines. Line Width of 1: This is a moderate line width and is used to provide standard thickness for line graphs. A line width of 1 provides a nice balance between being easy to see and looking clean and neat. Line Width of 2: This is a thicker line that can be used to emphasize certain data series or make the graph more visually striking. |
| Plot Null | Enable **Plot Null** to display null values on the graph. This is useful when you want to visualize missing data or gaps in your dataset. In the screenshot below, the toggle bar is disabled. Figure: Plot Null |
| Show Dots | Enable **Show Dots** to display the dotted points on the graph upon mouse hover. Adding dots to a line graph can help highlight individual data points and make the graph easier to read. Figure: Show Dots |
### Data Source
Application Designer can configure internal or external widgets by selecting source type under the **Data Source** tab. You can select the **Source** from the drop-down list.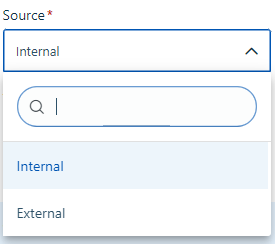Figure: Data Source type
**Data Source** (**In****ternal**)
This section contains the list of features using which the Application Designercan select **Source**, **Application**, **Module**, **Table**, **Form**, **X-Axis**, **Y-Axis** and **Series**.
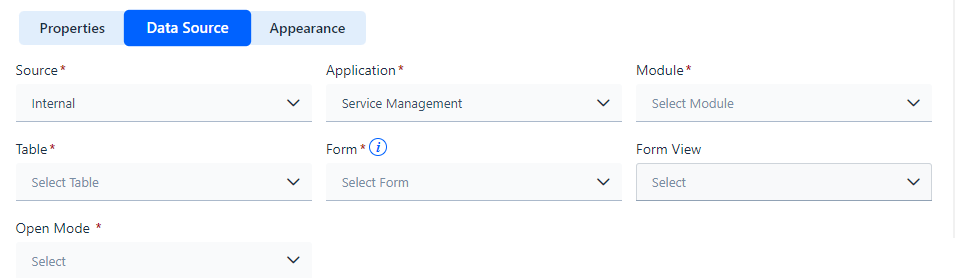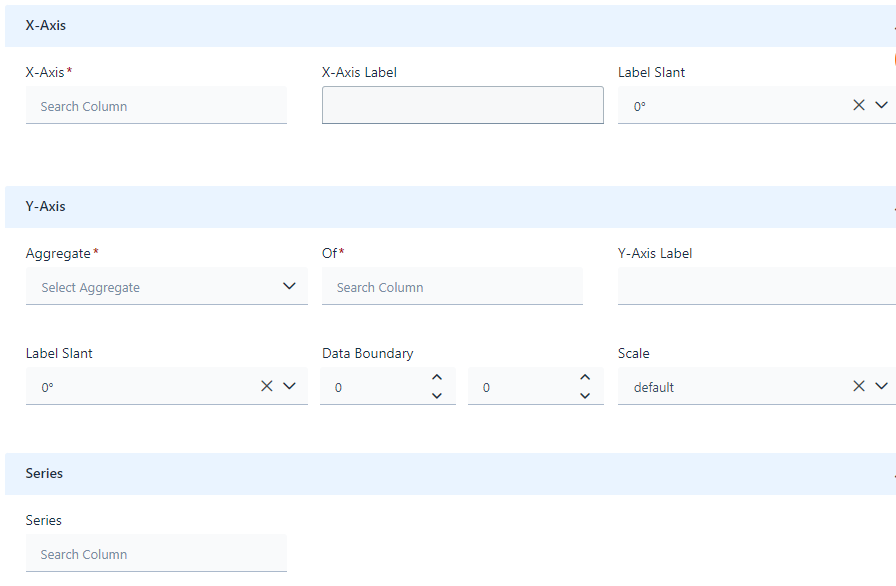
Figure: Data Source tab
The table below contains the list of fields and their descriptions that are available under the **Data Source** section: **Field Description**
| **Data Source** |
| --- |
| Internal | Select the **Date Source** as **Internal** from the drop-down list. |
| Application | Select the **Application** from which the data has to be fetched. The screen is shown with **Service Management** selected under the **Application** from the drop-down list.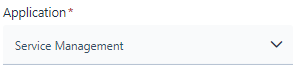Figure: Application |
| Module | Select the **Module** from which the data has to be fetched. The drop-down list populates based on application selection. The **M****odule** can be selected from the drop-down list. 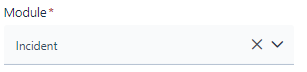Figure: Module Here **Incident** is selected under the **Module** drop-down list. |
| Table | Specify the **Table** from the drop-down list and and it populates based on module selection. Here **Manage Incidents** is selected under the **Table** drop-down. 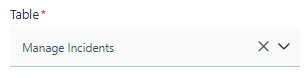Figure: Table |
| Form | Define the **Form** using which it should open when you click on the data widget. 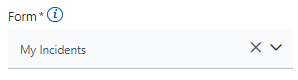 Figure: My Incident The forms mapped for the table should be selected. Here **My Incidents** is specified under **Form**. This field will appear only after the **Application** is selected. |
| **Condition** |
| Add Filter Set | Set the filter for the field, operator and values. Figure: Add Filter Set The screen below displays **Tenants** with **equal to** as **Operator** and **Information Technology** as **Value.** ****Figure: Screenshot For information about condition filters, see [Dynamic operators in Service Portal](https://help.symphonysummitai.com/summit-platform/docs/dynamic-operators-in-service-portal). |
| **X-Axis** |
| X-Axis | Enter the display name for **X-Axis** for line graph representation by selecting the field from the drop-down list. Here **X-Axis** is specified as **Workgroup**. 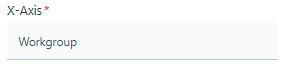Figure: X-Axis |
| X-Axis Label | Specify the label to the X-Axis variable using the textbox. |
| Label Slant | Specify the inclination for the label of X-Axis by choosing the angle in the **Label Slant** drop-down list. |
| **Y-Axis** |
| Aggregate | Define the **Aggregate** function to summarize the data fetched from the Y-Axis variable. Here **Count Records** is selected from the drop-down list for **Aggregate** field. 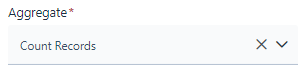Figure: Count Records |
| Of | Select the Column name from the drop-down list. 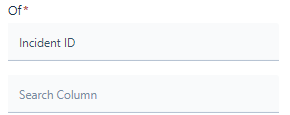Figure: Column Name |
| Y - Axis Label | Select the **Y-Axis Label** from the field value. Here Resolution SLA is selected as **Y****-Axis Label.**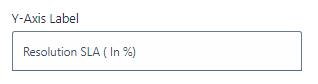Figure: Select the Label |
| Label Slant | Specify the inclination for the label of Y-Axis using the Label Slant drop-down list. |
| Data Boundary | Specify the Data Boundary value (maximum and minimum). |
| Scale | Select the scale of axis using the Scale drop-down list. |
| Series | Select the variable for Series for **Line** graph representation by selecting the field from **Series** drop-down list. 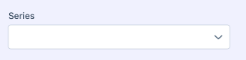Figure: Series selection 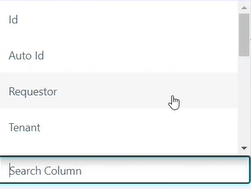Figure: Select the column name to split the data. |
**Data Source** (**External**)
This section contains the list of features using which the Application Designer can select **Source**, **API**, **Form**, **X-Axis**, **Y-Axis** and **Series**.

Figure: Data Source (External)
#### The table below contains the list of fields and their descriptions that are available under the **Data Source**(**External**) for configuring External widgets: Field Description
| **Data Source** |
| --- |
| **External** | Select the **Date Source** as **Ex****ternal**. |
| API | Select the **API** from which the data has to be fetched! |
| Forms | Select the form to define the form which opens when clicked anywhere on the Tabular data. |
###
### Manage Grouping and Scoping in Date and Time Fields
You can group the data with respect to Date by clicking the Group Data Radio Button. If the Date Time field is selected in X-Axis, then an option to Group Date gets displayed as shown below:
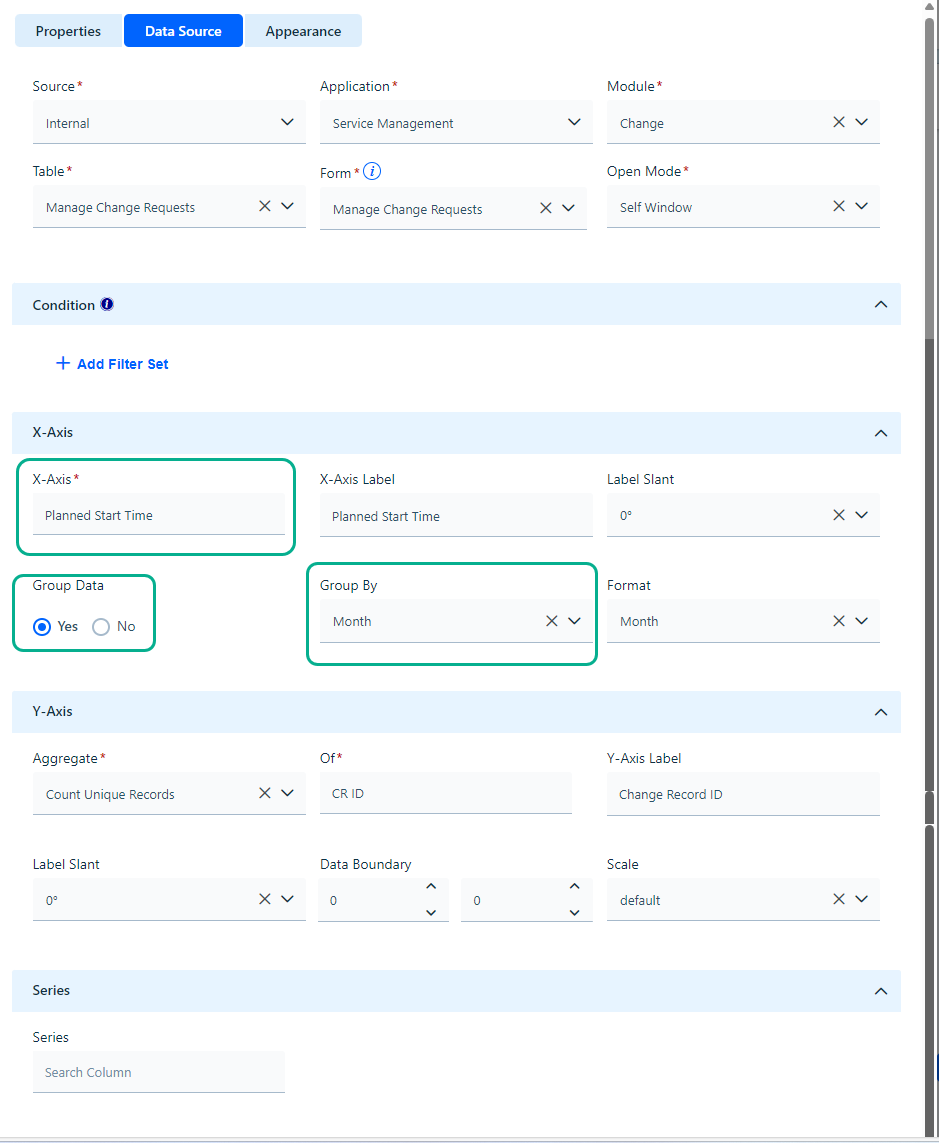 Figure: Date time field
Refer to the field Description for Group Data Option.
#### Field Description
| X-Axis |
| --- |
| X-Axis | Select a date time field value in the X-Axis. Here X-Axis label is selected as **Planned Start Time** under the field value. 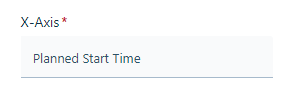Figure: Date time field |
| X-Axis Label | Specify the name of the label under the field. 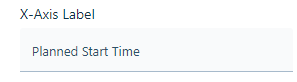Figure: Label Here Planned Start Time is given as label name. |
| Group Data | Select **Yes** to group the date time field value. 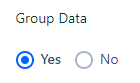 |
| Group Data | Select the time grouping criteria based on which the data will be grouped by selecting from Group By drop-down list. 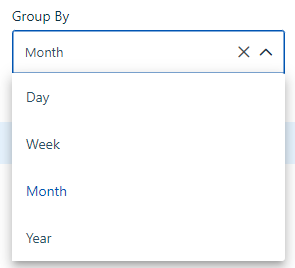Figure: Group Data |
| **Format** | Select the Format in which the date should appear by selecting from the Format drop-down list. When **Day** is selected in **Group By**, the Format drop-down list does not appear, and it shows **Date** for grouping data. Figure: Day When **Week** is selected in **Group By**, **Format** drop-down list is displayed as shown below: 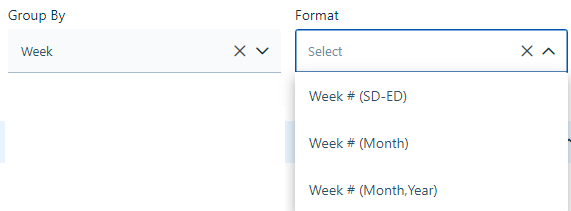Figure: Week You can group **Week** based on Week # (Start Date (SD)- End Date (ED)), Week # (Month), Week # (Month, Year) from the drop-down list. When **Month** is selected in **Group By**, **Format** drop-down list is displayed as shown below: 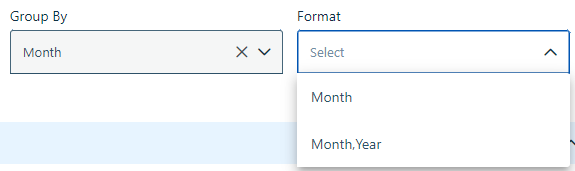Figure: Month You can group **Month** based on **Month** or **Month**, **Year** from the drop-down list. When **Year** is selected in **Group By**, **Format** drop-down list is not displayed. The year is displayed as per user preference. Figure: Year To know more about configuring global filter on Data Widgets, see [Time Filters in Data Widget.](https://help.symphonysummitai.com/summit-platform/docs/common-filters-in-service-portal) |
### Appearance
This section contains the list of features using which the Application Designercan select **Title**, **Color & Themes**, **Background,** and **Border**.
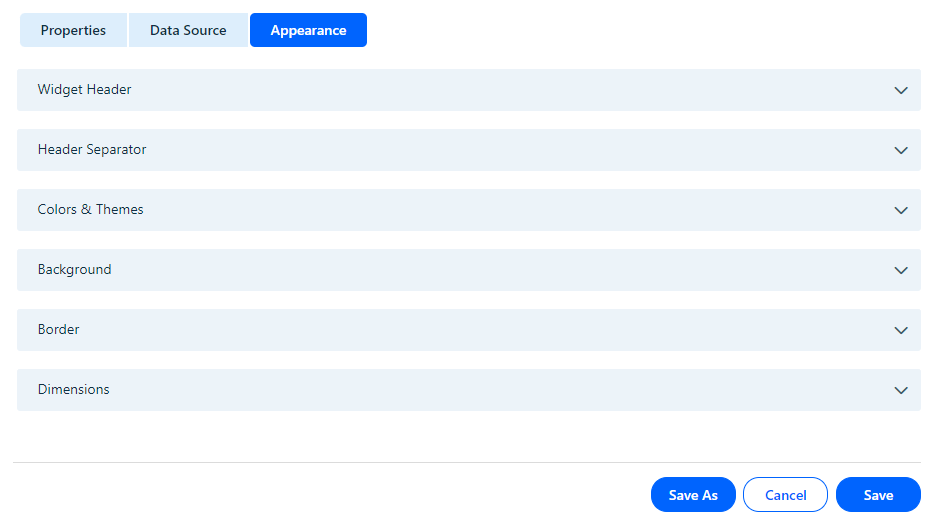Figure: Appearance
The table below contains the list of fields and their descriptions that are available under the **Appearance** section: Field Description
| Appearance |
| --- |
| Icon Position | Specify the **Si****ze** and **Padding** for the icon. Figure: Icon Position |
| **Widget Header** |
| Text Type | Define the text type of the Numeric widget. |
| Text Color | Select the text color of the Numeric widget. |
| Text Size | Select the preferred text size. |
| Text Style | Choose the style for the font. |
| Text Alignment | Select the preferred alignment for the font. |
| **Header Separator** |
| Border | Select the border style. |
| Width | Choose the preferred width for the Header. |
| Color | Select the header color of the widget. |
| **Color & Themes** |
| Configure Colors | Choose the color and theme for the illustration. 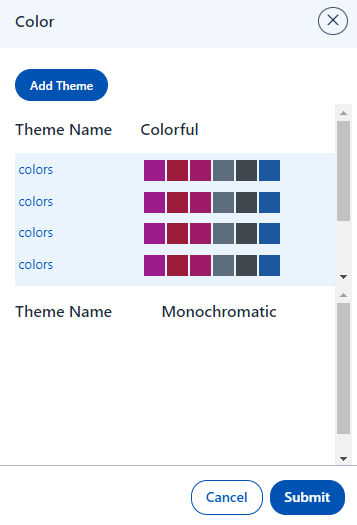Figure: Theme Name |
| **Background** |
| --- |
| Background Type | Select the preferred background type. Figure: Background |
| **Border** |
| --- |
| Border | Select the border by selecting desired Border Type from the drop-down list. |
| Dimension |
| --- |
| Dimension | Select the height and width for the widget from the drop-down list. Figure: Dimension |
Click **Save** to save the configuration. The configured **Line Graph** widget with and without date time field appears as shown below.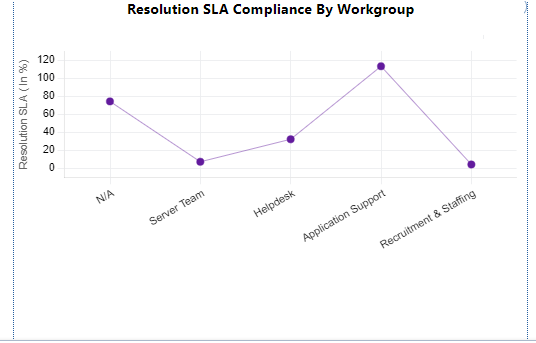
Figure: Resolution SLA Compliance By Workgroup (Without date time field)
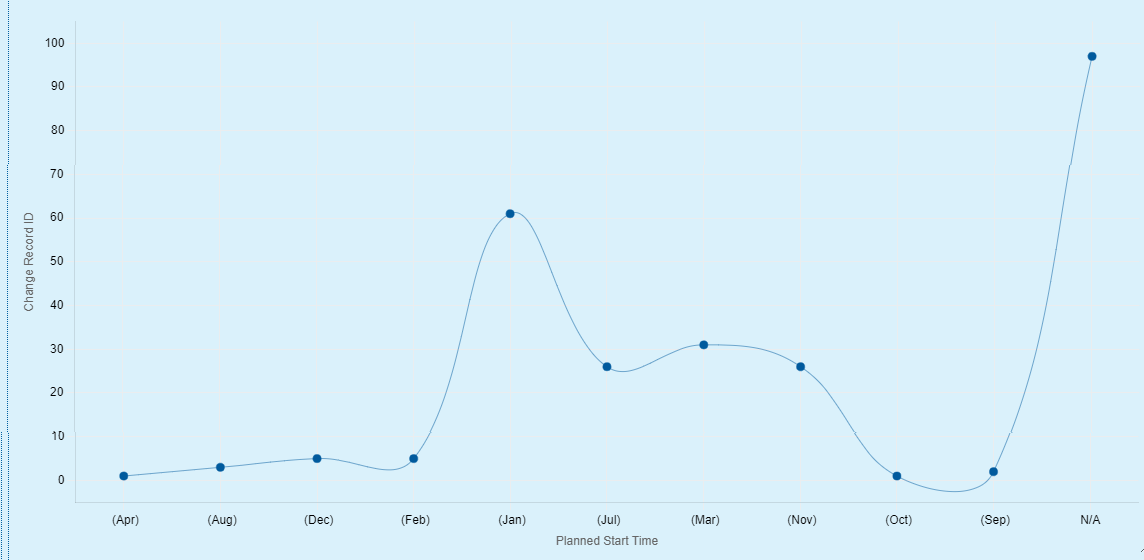
Figure: Change Record ID with Planned Start Time