---
title: "Numeric widgets"
slug: "numerical-widgets"
tags: ["Internal Numerical widget"]
updated: 2024-05-17T13:04:46Z
published: 2024-05-17T13:04:46Z
canonical: "help.symphonysummitai.com/numerical-widgets"
---
> ## Documentation Index
> Fetch the complete documentation index at: https://help.symphonysummitai.com/llms.txt
> Use this file to discover all available pages before exploring further.
# Numeric
**Numerical widget** can be used to sort, filter, and display the data in a numerical format.
You can use the widget to fetch the number of open incidents, resolved incidents, incidents pending feedback, etc.
Let's explore the following Use Case for designing the Numerical Widget!
| **Use Case:** Administrator | **Solution** |
| --- | --- |
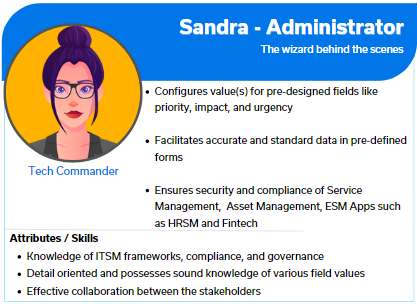
| Sandra at HR services wants to fetch leave balance from external Payroll applications. She needs a widget that allows her to organize, classify, and display external information in a numerical format. | Sam can utilize the Numeric widget to customize the HR tool data presentation, showcasing the count of leaves in a scorecard format. Sam provides customization options within the Numeric widget, enabling users like Sandra to interact with the scorecard dynamically. Sandra can apply filters, drill down into detailed leave data, and customize the visualization preferences according to her specific requirements. |
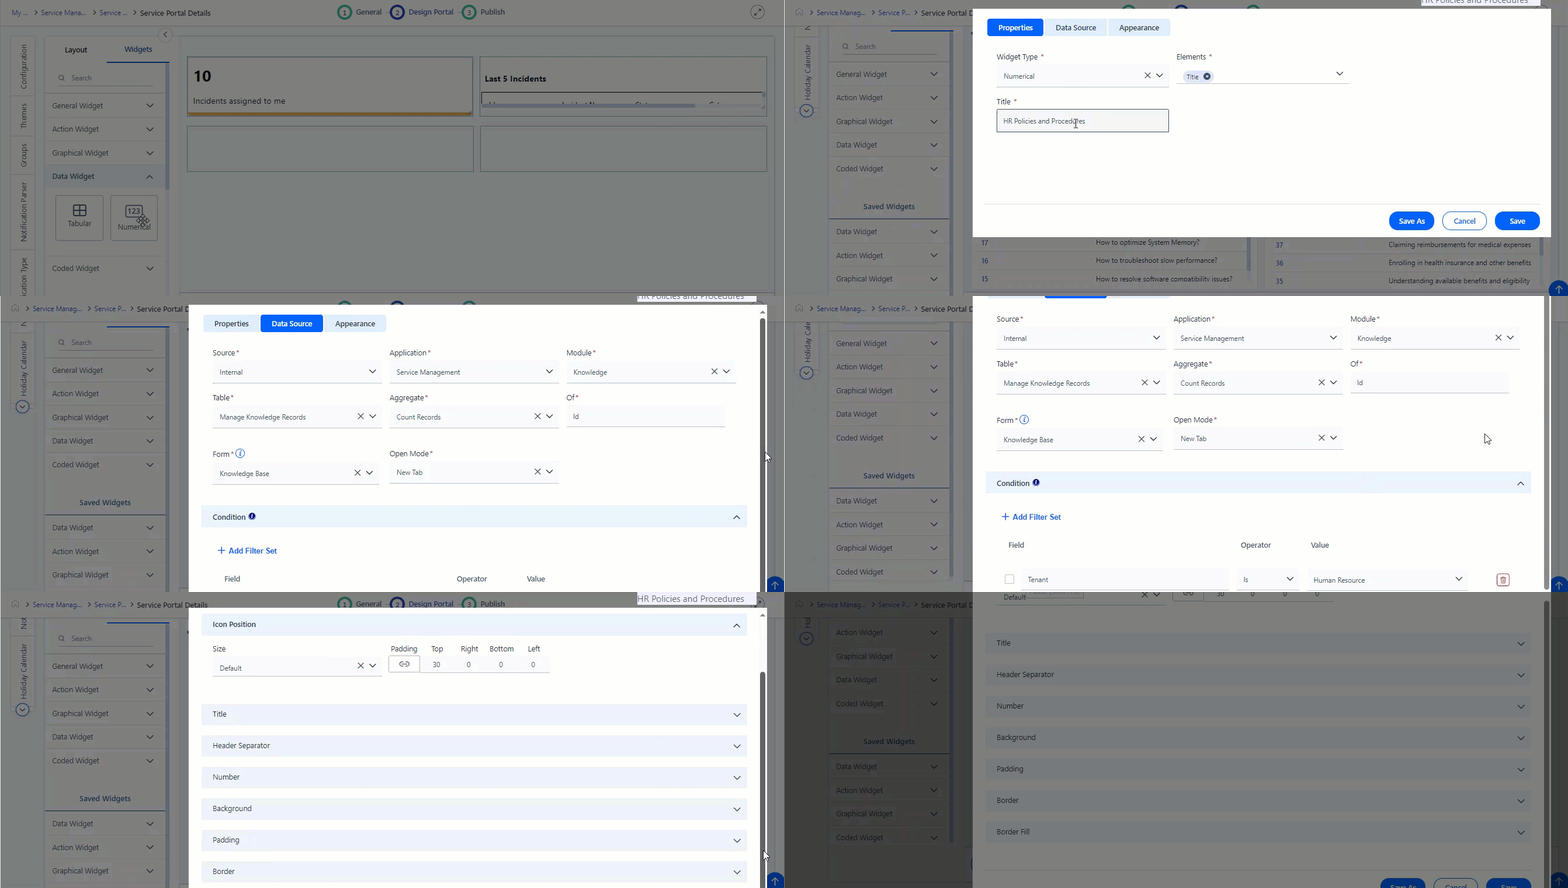
For details about the Use Case, refer to the graphics below:
## Configure Numerical Widget
This section contains the list of steps using which Application Designer can add the widget in the Service Portal screen.
1. Navigate to **Design** **Portal** > **Widgets** > **Numerical** **Widget**.
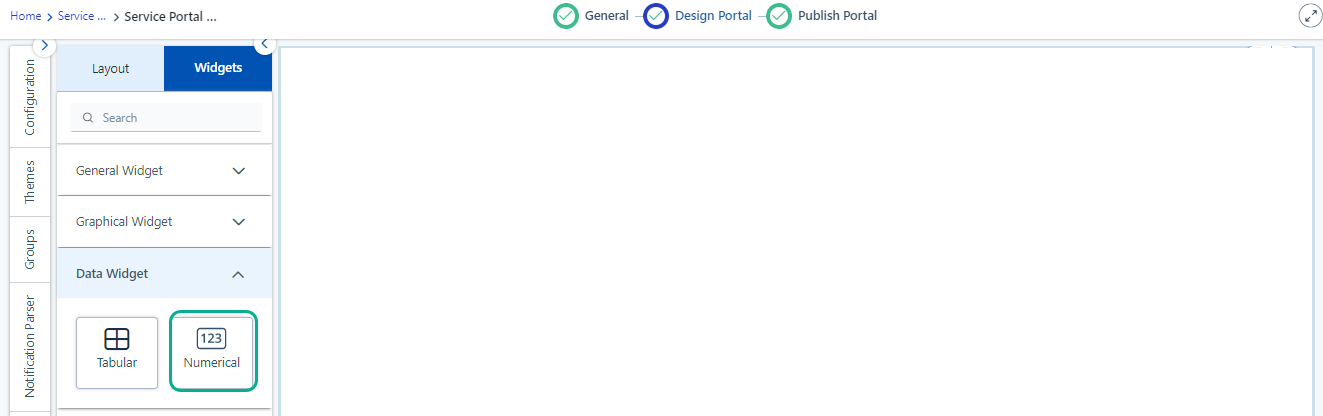 Figure: Adding Widgets
2. Customize the Service Portal by dragging the **Numerical** Widget from the widget list screen.Figure: Numeric Widget
3. Click **Settings** icon for this field to view the Properties pop-up.
Figure: Modify the properties
You can view the following tabs on the **Settings** for this field:
- [Properties](/summit-platform/docs/numerical-widgets#properties)
- [Data Source](/summit-platform/docs/numerical-widgets#data-source)
- [Appearance](/summit-platform/docs/numerical-widgets#appearance)[](/summitai-platform/docs/internal-numeric-widgets#code)
### Properties
This section contains the list of properties using which the Application Designer can configure the widget features. 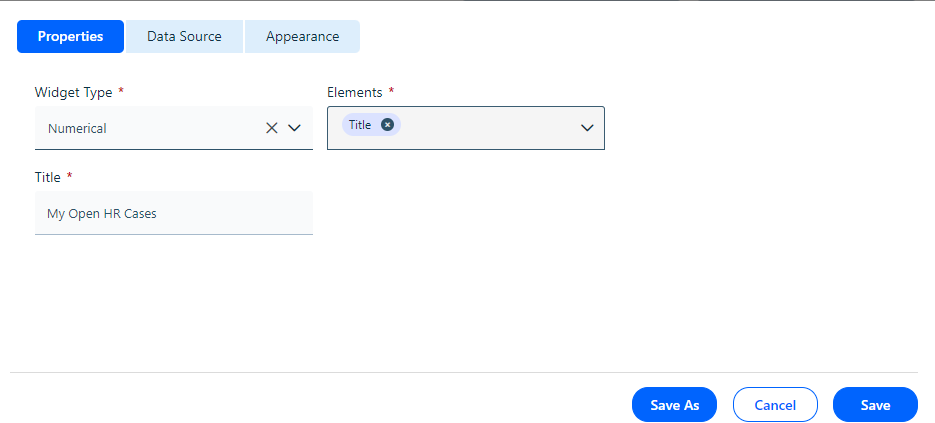
Figure: Properties The table below contains the list of fields and their descriptions that are available under the Properties section:
Field Description
| Properties |
| --- |
| Widget Type | Select **Numerical Widget** from the drop-down list. |
| Title | Type a name to the widget according to the Data to be configured in the widget title textbox. 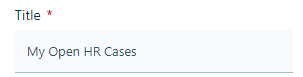For example: Let us create a **Numerical** **Widget** to show the count of HR Cases. The widget can be titled **My Open** **HR Cases****.** |
| Elements | Add the elements such as **Title** or **Header** based on the requirement. 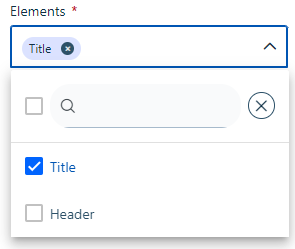Figure: Elements |
### Data Source
Application Designer can configure internal or external widgets by selecting source type under the **Data Source** tab. You can select the **Source** from the drop-down list. 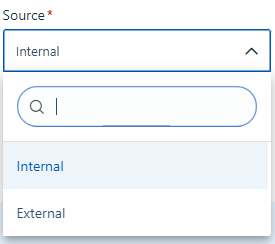Figure: Data Source type
If you select **In****ternal** as Source type, then you need to select **Source**, **Application**, **Module**, **Table**, **Aggregate**, **Form**, and **Conditions**. Refer to screenshot for more details.
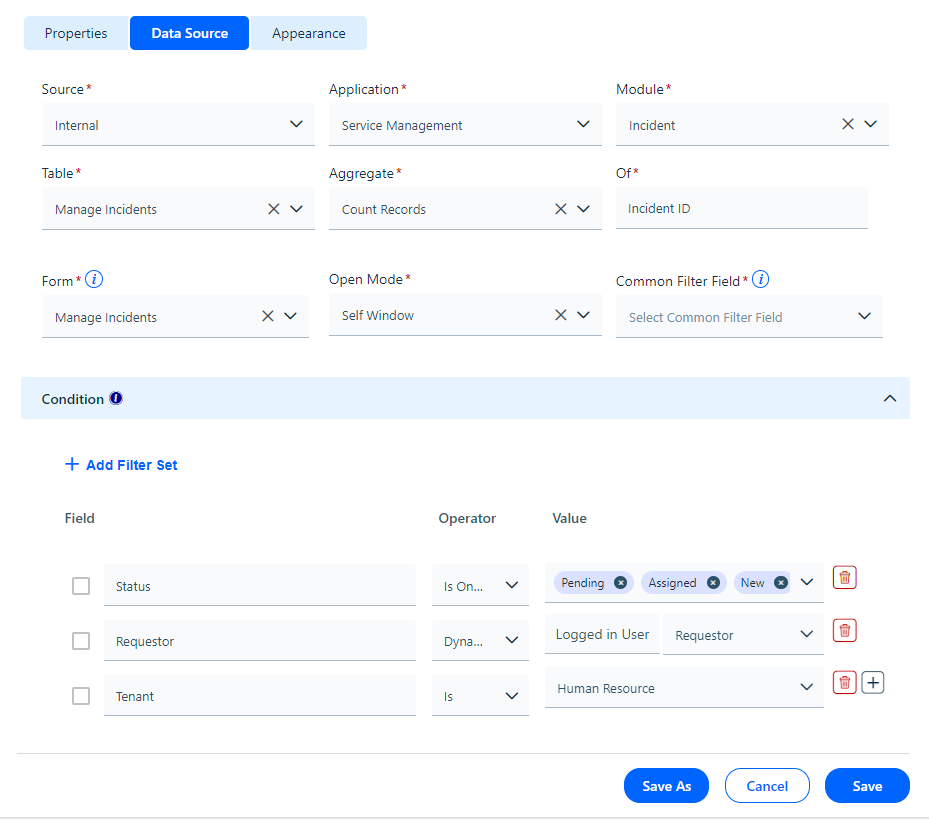 Figure: Data Source Refer to field description for more details.
| **Data Source** |
| --- |
| Internal | Select the **Date Source** as **Internal** from the drop-down list.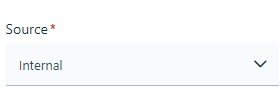Figure: Internal |
| Application | Select the **Application** from the drop-down list. Here Service Management is from the drop-down list.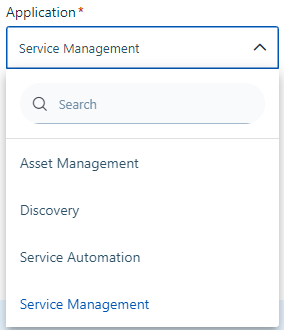Figure: Application |
| Module | Select the Module from which the data has to be fetched. The drop-down list populated based on Application selection. Here **Incident** is selected as a module from the drop-down list. |
| Table | Select the Table from the drop-down list. The screen displays for table selected as **Manage Incidents**.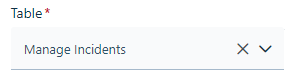Figure: Table |
| Aggregate | Define the **Aggregate** function to summarize the data by selecting from the drop-down list. The Aggregate functions can be: Count Unique Records, Count Records, Sum values, Average, Min and Max. 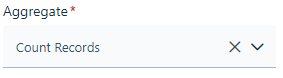Figure: Aggregate functions Here Aggregate function is selected as **Count Records**. |
| Of | Select the column name for which you need the Aggregate for the data.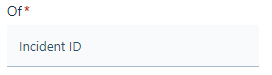Figure: Of field |
| Form | Select the **Form** from which data needs to be fetched. The drop-down list for Form is populated based on Module selection. Here **Manage Incidents** is selected from the drop-down list. 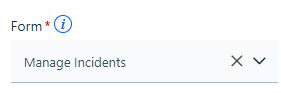Figure: Form Here **Manage Incidents** is specified under **Form**. This control appears after application selection. |
| Open Mode | Select the mode record should open: **New Tab** or **Self Window**. 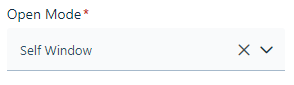Figure: Open Mode |
| Common Filter Field | Select the date time field from the drop-down list on which common filter field can be applied. For example, if you have a scorecard showing Count of Open Incidents, you can apply common filter to get the count of Incidents created in last 5 days. Here under the **Common Filter** field **Created On** can be selected. 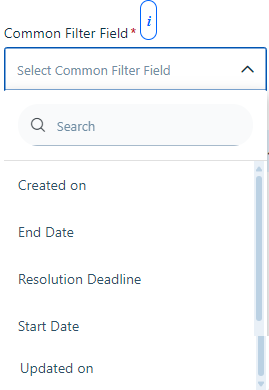Figure: Common Filter For details about configuring filters, see [Common Filters](https://help.symphonysummitai.com/summit-platform/docs/common-filters-in-service-portal). |
| Condition |
| Add Filter Set | Set the filter for the field, operator, and values. Here in the screenshot operator and values are set for Status, Requestor and Tenant.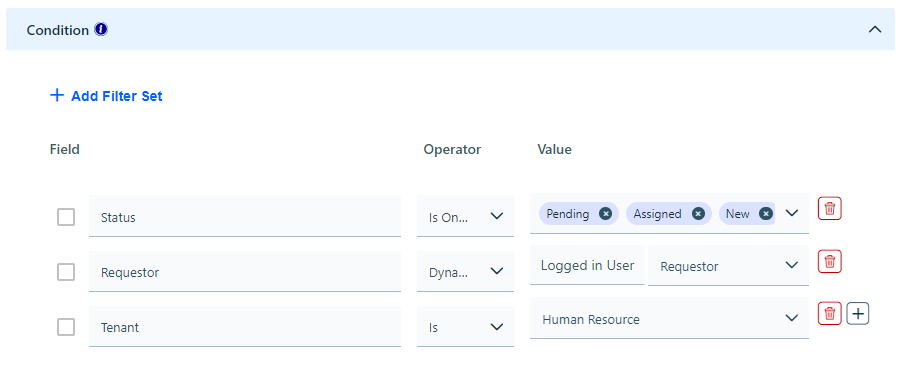 Figure: Add Filter Set For more information about Conditions, refer to [Dynamic operators in Service Portal](https://help.symphonysummitai.com/summit-platform/docs/dynamic-operators-in-service-portal). |
If you select **Ex****ternal** as the Source type, then it fetches the results from a third-party app. The screen contains the list of features using which Application Designer can select **Source,** **Form**, **API**, **Form**, **Aggregate**, and **Condition** for the **Data Source. Refer to screenshot for more details.**
**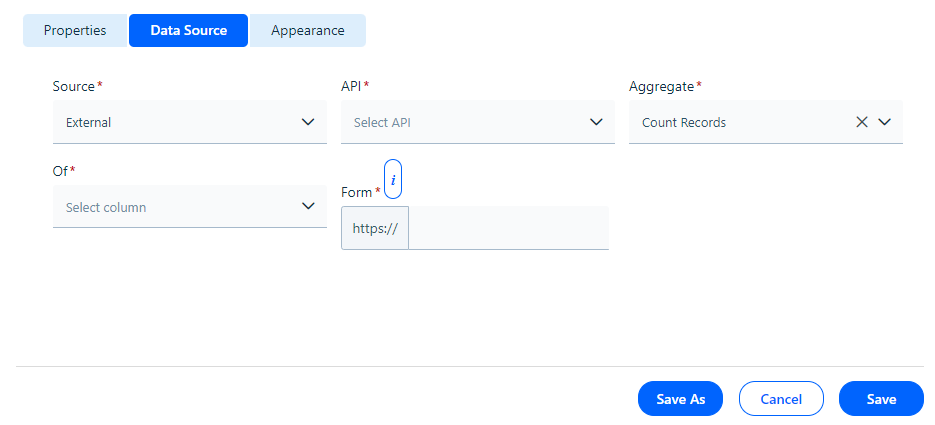**Figure: External source
The table below contains the list of fields and their descriptions that are available under the **Data Source** section. Field Description
| **Data Source** |
| --- |
| External | Select the **Date Source** as **Ex****ternal** from the drop-down list. |
| API | Specify the URL that should appear when you click on the row in the Table. The link for this form appears in the new tab.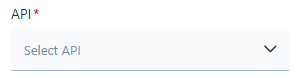Figure: API selection |
| Get Response | Click the **Get Response** button to fetch data from third party applications. The data is fetched from the API selected and stored in a temporary table Figure: Get Response |
| Test Now | Preview the data fetched by clicking the **Test Now** button. |
| Aggregate | Select the **Aggregate** function to summarize the data by selecting from the drop-down list. The Aggregate functions can be: Count Unique Records, Count Records, Sum values, Average, Min and Max.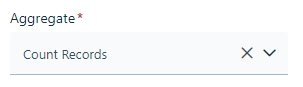Figure: Aggregate functions Here the aggregate function is selected as **Count Records**. |
| Of | Select the column name for which you need the Aggregate values. 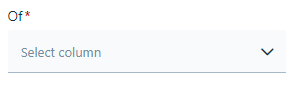Figure: Column name |
| Form | Define the **Form** using which URL should open when you click on the data widget.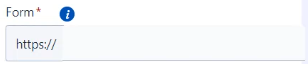Figure: Form |
| **Condition** |
| Add Filter Set | Set the filter for the field, operator, and values. The screen below displays **Tenants** with **equal to** as **Operator** and **Information Technology** as **Value.**Figure: Screenshot If you want to add more conditions, click the **+** icon. |
### Appearance
This section contains the list of features using which the Application Designercan select **Icon**, **Title**, **Table Design**, **Header Text**, **Data Text**, and **Background**.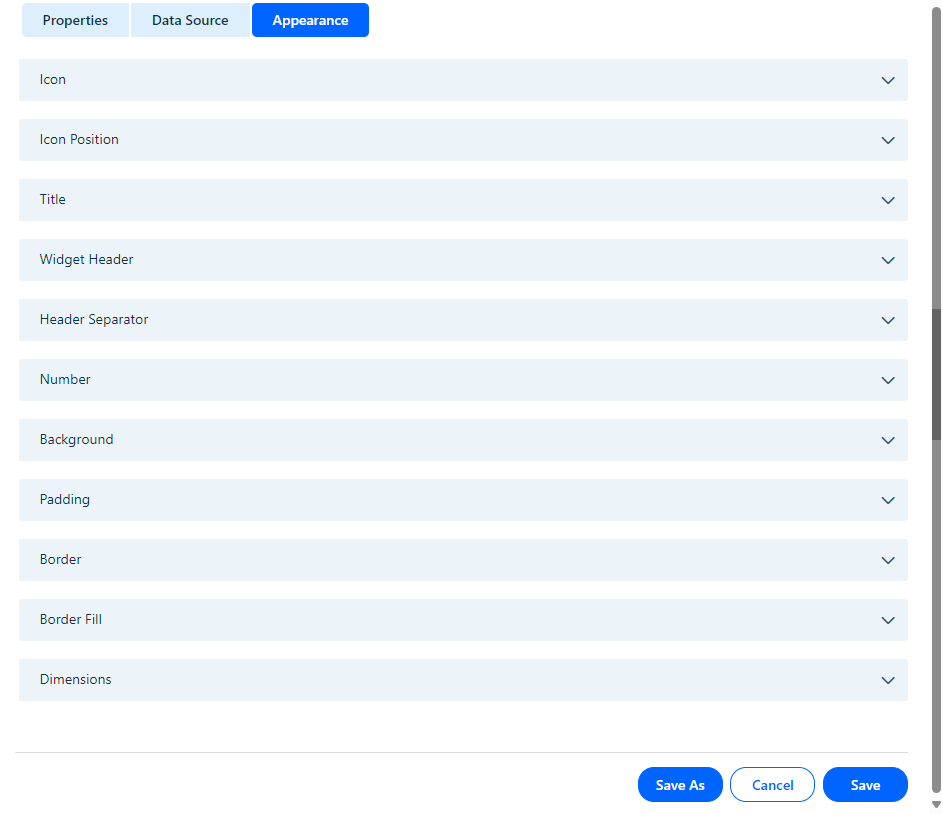
Figure: Appearance tab
The table below contains the list of fields and their descriptions that are available under the **Appearance** section:
Field Description
| Appearance |
| --- |
| **Icon** |
| Icon Upload | Select the Icon to be uploaded. Figure: Icon selection |
| Icon Position | Select the position for the icon by selecting the size and padding.Figure: Icon size and Padding |
| **Title** |
| Text Type | Define the text type. |
| Text Color | Select the text color for widget. |
| Text Size | Select the preferred text size. |
| Text Style | Choose the style for the font. |
| Text Alignment | Select the preferred alignment for the font. |
| Widget Header |
| Text Type | Define the text type for Widget Header. 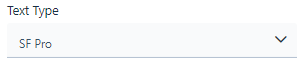Figure: Text Type |
| Text Color | Select the text color for Widget Header. |
| Text Size | Select the preferred text size for Widget Header. |
| Text Style | Choose the style for Widget Header font. |
| Text Alignment | Select the preferred alignment for the Widget Header font. |
| Header Separator |
| Border | Select the type of border. 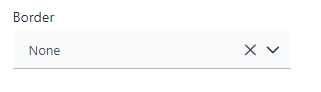Figure: Border Type |
| Width | Select the Width for Header Separator from the drop-down list. 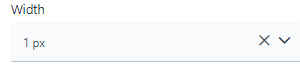Figure: Width |
| Color | Select the Color for the Header Seperator from color palette. 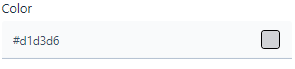Figure: Color |
| Number |
| Text Type | Select the text type for the number. Here Default System Font is selected for the Number text.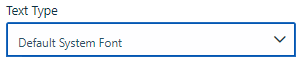Figure: Text Type |
| Text Size | Select the text size for the number. 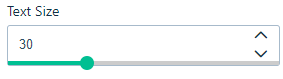 |
| Text Color | Select the text color type for the number from the drop-down list. Use **Static** text color type regardless of the number that populates. If incidents are open and the chosen color is green, then the chosen color remains green irrespective of the count of open incidents. Value-based text color type offers a range of color options where you can specify the range and corresponding color code. For example, if there are five or fewer incident violations, use the value-based text color type. Set the range from 0 to 5 and select the color (for example, Amber) for the number text accordingly. 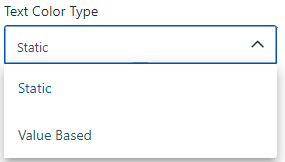Figure: Text Color type If you select **Static** from the drop-down list, then select the text size, and text alignment and pick the required color from the color palette for the color text. 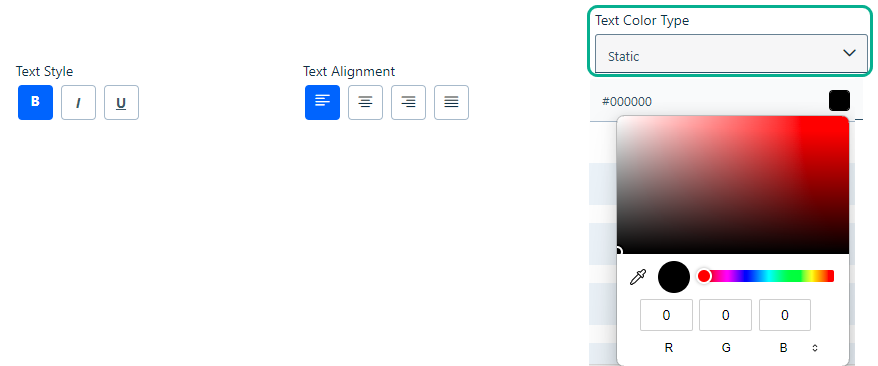Figure: Static The configured number text using Static color type appears under consumer screen as shown below: 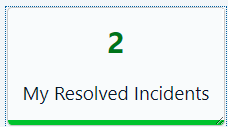 Figure: Static color type If you select **Value Based** on the drop-down list, then select the color and icon in between, less than or more than on the drop-down list.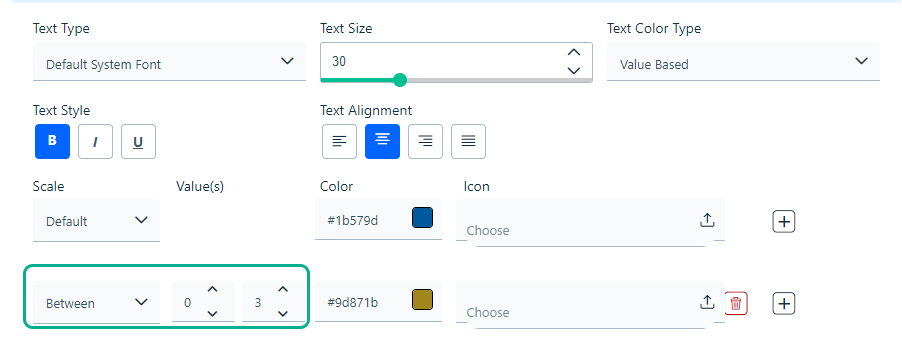 Figure: Value Based |
| **Background** |
| Background Type | Select the preferred background type. Figure: Background |
| **Padding** | Specify the preferred padding width. By default, the field appears inactive as shown below. 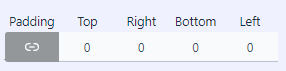Figure: Padding width with zero value Click the icon to enable padding width. 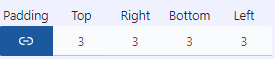Figure: Padding width as 3. |
| **Border** | Select the border style by selecting desired **Border** type from the drop-down list. 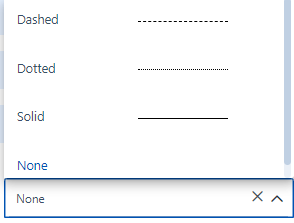Figure: Border Type |
| **Border Fill** | Select the border fill for the widget from the drop-down list. 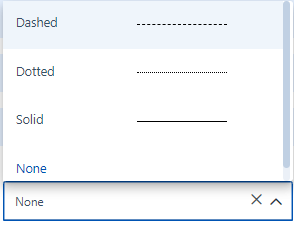Figure: Border Fill |
| **Dimension** | Select the widget's height and width from the drop-down list. You can set the height in pixels (px) and the width in both percentage (%) and pixels (px). Using a percentage for width allows the widget to fill the container's width.Figure: Dimension |
**Save** the details and navigate to Service portal screen to check the configured **Numerical** widget. 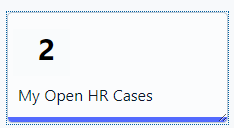
Figure: Numerical Widget