---
title: "Pie Chart V2"
slug: "pie-chart-v2"
updated: 2024-04-16T05:48:51Z
published: 2024-04-16T05:48:51Z
canonical: "help.symphonysummitai.com/pie-chart-v2"
---
> ## Documentation Index
> Fetch the complete documentation index at: https://help.symphonysummitai.com/llms.txt
> Use this file to discover all available pages before exploring further.
# Pie Chart V2
**Pie Charts: Slicing through data to reveal the bigger picture**!
**Pie Charts** widget is used to represent data with categorical values in various applications.
Let's start configuring the widgets then!
User persona: Application Designer

Let's explore the following Use Case for configuring the Pie Chart widget!
| **Use Case** | **Solution** |
| --- | --- |
| Jade, the IT Service Manager wants to assess the performance of their incident management process to ensure that incidents are being resolved efficiently and within the defined service level agreements (SLAs). The IT service manager wants a widget to visualize the distribution of incidents based on their current status. | Sam, the Application Designer can select the **Pie Chart** widget and configure it as an **internal** widget under the settings option. Based on the pie chart, the IT service manager can quickly identify that a significant portion of incidents are in the **Resolved** state. This could indicate that incidents are being resolved but not closed properly, which may impact SLA adherence. The manager can then investigate further and take corrective actions to ensure that incidents are closed on time. |
## Configure the Pie Chart widget
This section contains the list of steps using which {{variable.Role - Application Designer}} can add the widget in the Service Portal screen.
1. Navigate to **Home** > **Service Portal** > **Add Service Portal** > **Widgets** > **Add Widget**.
2. Customize the Service Portal by dragging the widget from the widget list screen.Figure: Pie Chart
3. Click the icon for this field to view the Properties pop-up.
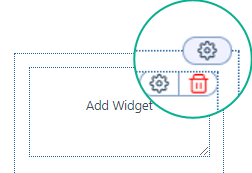Figure: Modify the properties
You can view the following tabs on the **Settings** for this field:
- [Properties](/summit-platform/docs/pie-chart-v2#properties)
- [Data Source](/summit-platform/docs/pie-chart-v2#data-source)
- [Appearance](/summit-platform/docs/pie-chart-v2#appearance)[](/summitai-platform/docs/internal-pie-chart#code)
### Properties
The table below contains the list of fields and their descriptions that are available under the **Properties** section:
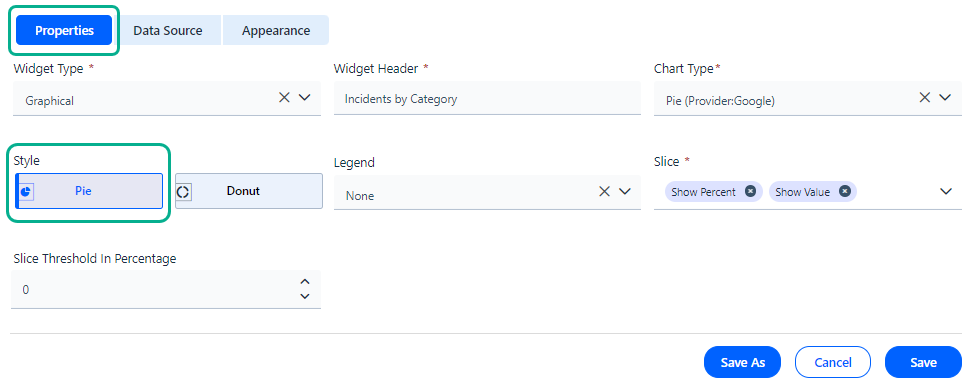
Figure: Properties tab
To know more about the fields that are available under the **Properties** section, see the Field Description given below.
**Field Description**
| **Properties** |
| --- |
| Widget Type | Select **Graphical widget** from the drop-down list. |
| Widget Header | Type a name to widget according to the Data to be configured in the widget title textbox. |
| Chart Type | Select the **Chart Type** as 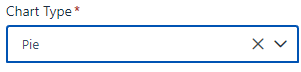 |
| Style | Select the style of the chart by selecting from the drop-down list.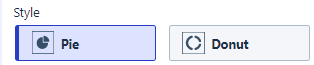Figure: Style |
| Legend | Select the **Legend** position on the line chart from the Legend drop-down list. |
| Slice | Select **Percentage** or **Value** to display values on the chart. |
| Slice Threshold in Percentage | Select the slice threshold percentage from the drop-down list. |
### Data Source
Application Designer can configure internal or external tabular widgets by selecting source type under the **Data Source** tab.
**Data Source** (**In****ternal**)
This section contains the list of features using which the Application Designercan select **Source**, **Application**, **Module**, **Table**, **Slice**, and **Form**.
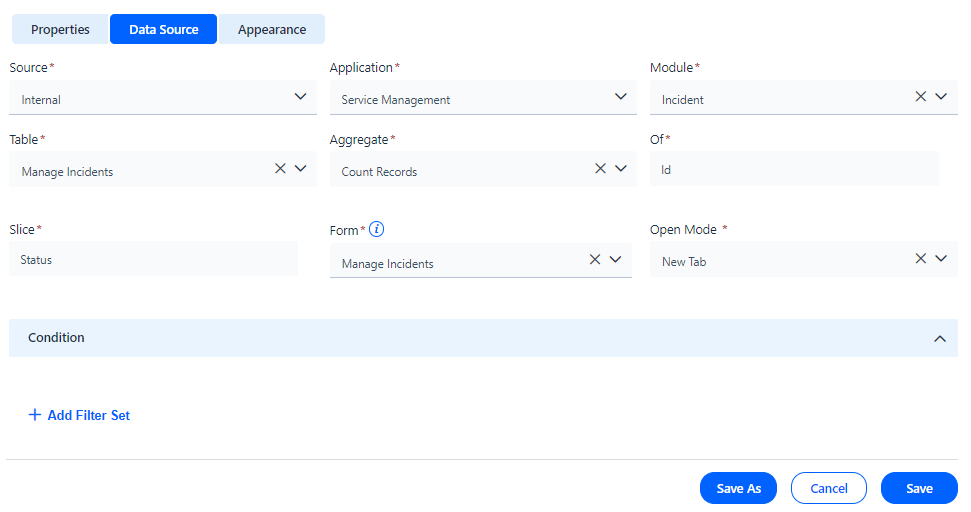
Figure: Data Source tab
The table below contains the list of fields and their descriptions that are available under the **Data Source** section: **Field Description**
| **Data Source** |
| --- |
| Internal | Select the **Date Source** as **Internal** from the drop-down list. |
| Application | Select the **Application** from which the data has to be fetched! |
| Module | Select the Module from which the data has to be fetched. The module can be selected from the drop-down list. |
| Table | Specify the Table from the drop-down list. |
| Aggregate | Define the aggregate function to summarize the data. |
| Of | Select the Column name from the drop-down list. |
| Slice | Select the name of the **Slice** from the drop-down list. |
| Form | Define the **Form** using which it should open when you click on the data widget. |
| Form View | Select the Form view from the drop-down list as shown in the screenshot. |
| Open Mode | Select the mode of opening the form from the drop-down list. |
| **Condition** |
| Add Filter Set | Set the filter for the field, operator and values. Figure: Add Filter Set The screen below displays **Tenants** with **equal to** as **Operator** and **Information Technology** as **Value.** ****Figure: Screenshot |
#### **Data Source** (**External**)
This section contains the list of features using which the Application Designer can select **Source**, **API**, **Form**, and **Condition**.
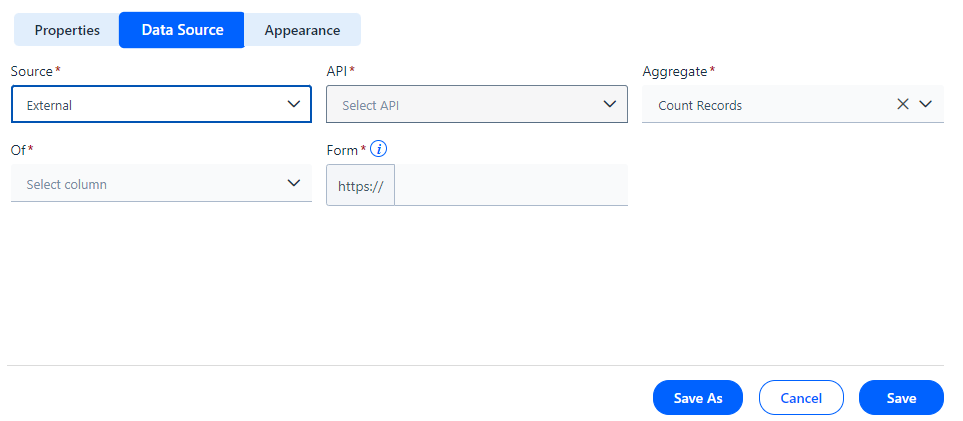
Figure: Data Source (External)
| **Data Source** |
| --- |
| **External** | Select the **Date Source** as **Ex****ternal**. |
| API | Select the **API** from which the data has to be fetched. |
| Aggregate | Select the type of aggregate from the drop-down list. |
| Of | Select the column type from the drop-down list. |
| Form | Select the form type from the drop-down list. |
### Appearance
This section contains the list of features using which the Application Designercan select **Title**, **Color & Themes**, **Background,** and **Border**.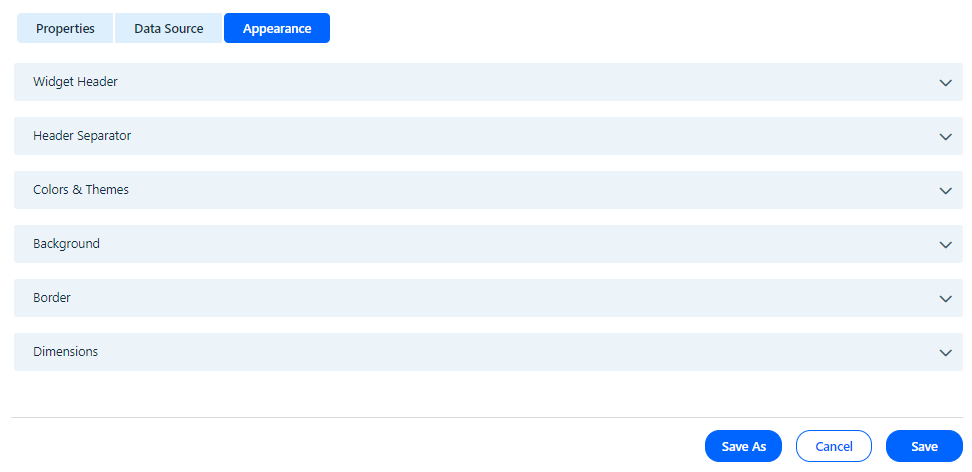
Figure: Appearance
The table below contains the list of fields and their descriptions that are available under the **Appearance** section:
**Field Description**
| Appearance |
| --- |
| **Widget Header** |
| Text Type | Define the text type of the Numeric widget. |
| Text Color | Select the text color of the Numeric widget. |
| Text Size | Select the preferred text size. |
| Text Style | Choose the style for the font. |
| Text Alignment | Select the preferred alignment for the font. |
| **Header Separator** |
| Border | Select the border style. |
| Width | Choose the preferred width for the Header. |
| Color | Select the header color of the widget. |
| Color & Themes |
| Configure Colors | Choose the color and theme for the illustration. 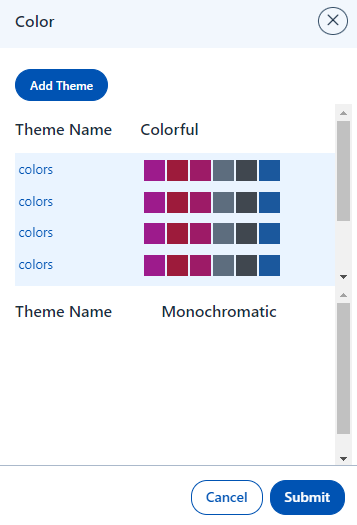Figure: Theme Name |
| **Background** |
| --- |
| Background Type | Select the preferred background type. Figure: Background |
| **Border** |
| --- |
| Border | You can style the border by selecting desired **Border** Type. |
| **Dimensions** |
| --- |
| **Dimensions** | You can style the border by selecting the desired Dimension value.Figure: Dimension |
Click **Save** to save the configuration. The configured **Pie Chart** widget appears as shown below.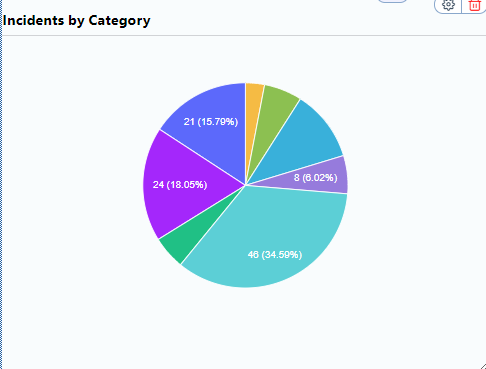
Figure: Incidents by Category