Network discovery identifies Windows computers, Linux systems, and network devices within a specified network scope. It uses the following protocols:
Windows Management Instrumentation (WMI): Collects information from Windows workstations and servers.
Secure Shell (SSH): Connects to Linux systems to collect inventory information.
Simple Network Management Protocol (SNMP): Collects information from compatible network devices, such as routers, switches, and firewalls.
Use this job type to discover individual hosts or groups of devices within an address range or subnet. Select the methods and credentials appropriate to the target devices.
Example: An administrator creates a Network discovery job for a branch office subnet, using WMI for Windows computers, SSH for Linux servers, and SNMP for switches.
To create a new job for Network Discovery, perform the following steps:
Click Workspace > ITAM > Asset > Discovery > Discovery Jobs.
The Discovery Jobs list page is displayed.Click New Job.
On New Job, select the job type that matches your discovery source.
 Figure: New Job
Job type
Purpose shown on the selection screen
Network
Discover Windows through WMI, Linux through SSH, and network devices through SNMP.
Cloud
Enumerate virtual machines and resources across AWS, Azure, GCP, and Oracle Cloud.
Container
Discover Docker containers and Kubernetes resources.
Hypervisor
Discover guest VMs through virtualization platforms.
Database
Connect to database engines to discover instances and inventory.
Directory
Discover Active Directory information without an agent.
Storage / SAN
Discover storage systems through supported platform interfaces.
Select Network on the new job.
On Identity, select the tenant and enter a descriptive job name.
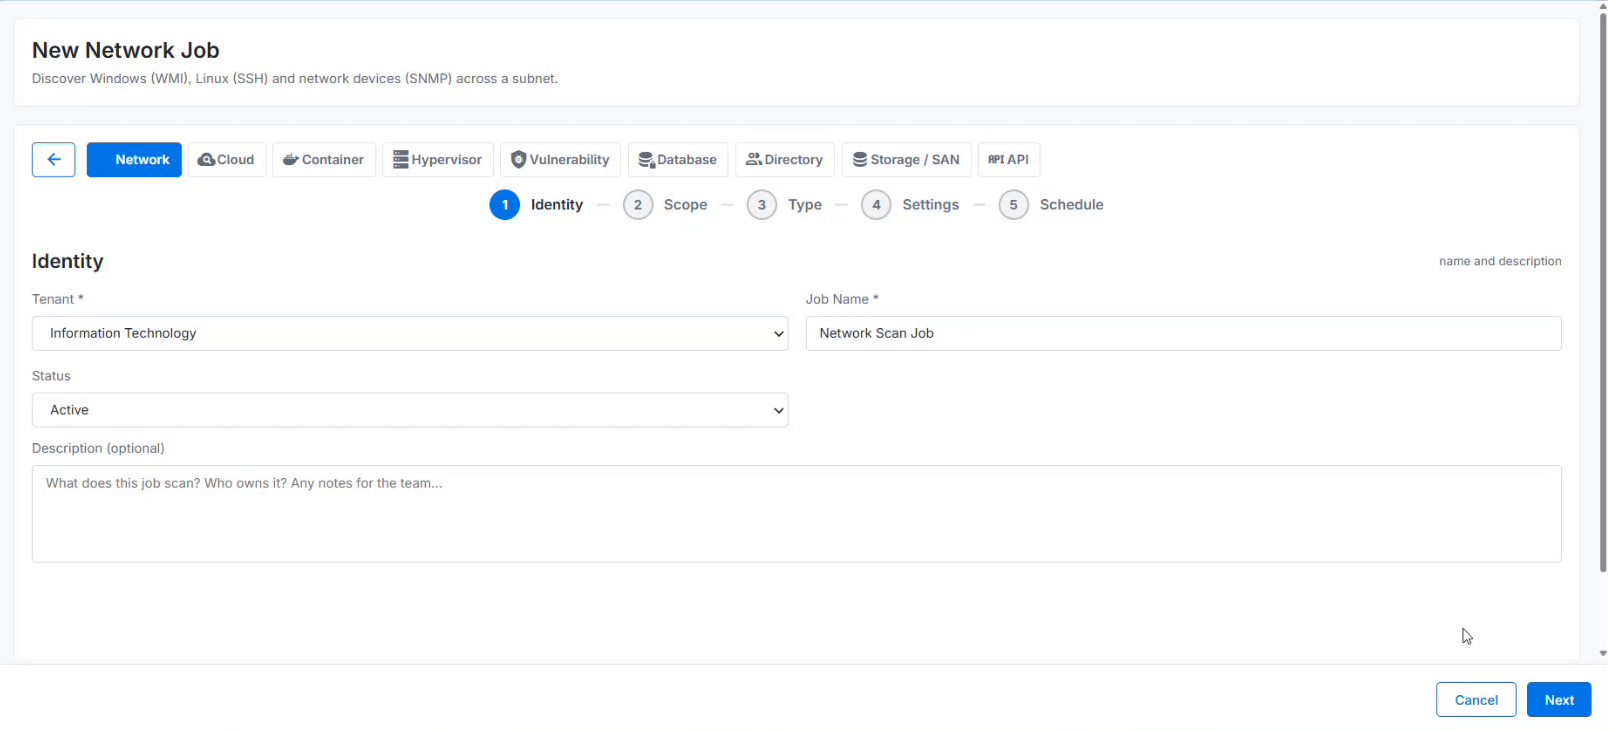
Figure: IdentityField name
Description
Tenant *
Tenant context associated with the job. The demonstration displays Information Technology.
Job Name *
Name used to identify the job in the jobs list and run details. Example: HQ Windows Inventory.
Status
Activation state selected for the job. The demonstration shows Active.
Description (optional)
Purpose, scope notes, ownership, or other context for the team.
Next
Continues to the next wizard stage.
Cancel
Leaves the wizard. Confirm any save or discard behavior presented by the application.
Click Next to open Scope.
On Scope & Exclusions, choose the scope type.
Enter the corresponding addresses. For a subnet scan, enter its CIDR block.
Add addresses, ranges, CIDRs, or hosts to exclude, one entry per line where the control is available.
Review the target boundaries and click Next.
For a branch subnet, select CIDR Subnet and enter 192.168.50.0/24. Exclude any management or sensitive targets that the network team has removed from the approved scan list. First test the worker and credentials against one representative host.Configure an address range.
Select IP Range (start - end).
Enter Start IP and End IP, for example 192.168.50.10 and 192.168.50.40.
Review any exclusions, and continue to Type.
Configure a host list.
Select IP List (multiple).
Enter the approved addresses or hostnames, one per line or separated by commas.
Check spelling, DNS resolution where applicable, and the completeness of the list.
Click Next.
Use a single host during initial validation. Expand to a list, range, or subnet only after checking that the selected worker can collect the expected data.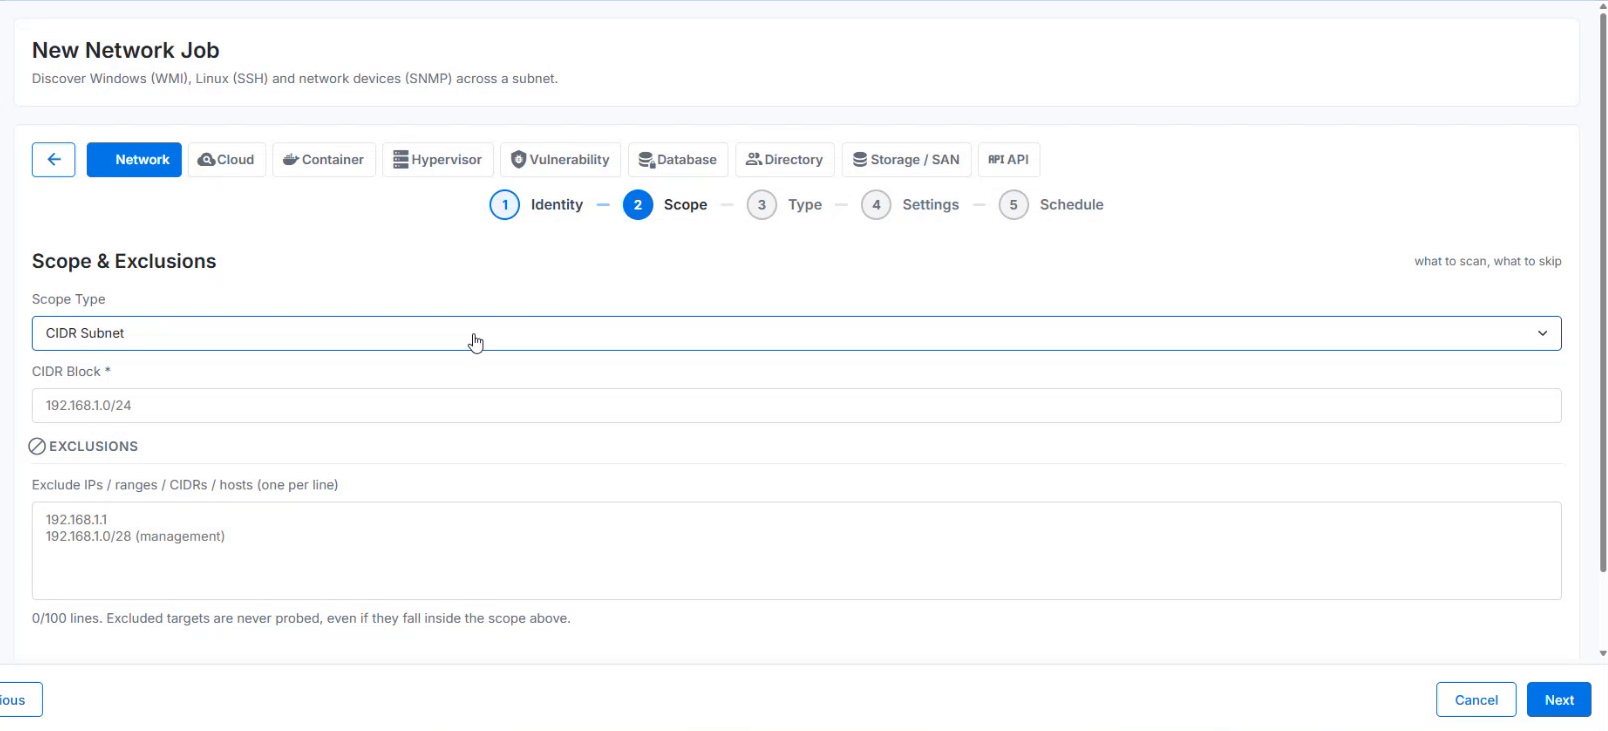
Figure: CIDR Scope and exclusionsField name
Description
Scope Type
Selects Single Host / IP, IP Range (start - end), CIDR Subnet, or IP List (multiple).
CIDR Block *
Subnet address and prefix for CIDR Subnet. Example: 192.168.50.0/24. Confirm the resulting range before scanning.
Start IP * / End IP *
Beginning and ending addresses for IP Range (start - end).
Exclude IPs / ranges / CIDRs / hosts (one per line)
Targets to skip within the scan scope. The UI states that excluded targets are never probed, even when they fall inside the scope.
On Type & Credentials, select the applicable WMI, SSH, or SNMP methods.
For each selected method, add a stored credential. Use quick creation if a suitable credential is not yet available.
Use the up and down controls to arrange the displayed execution order.
Review the methods and selected credentials, then click Next.
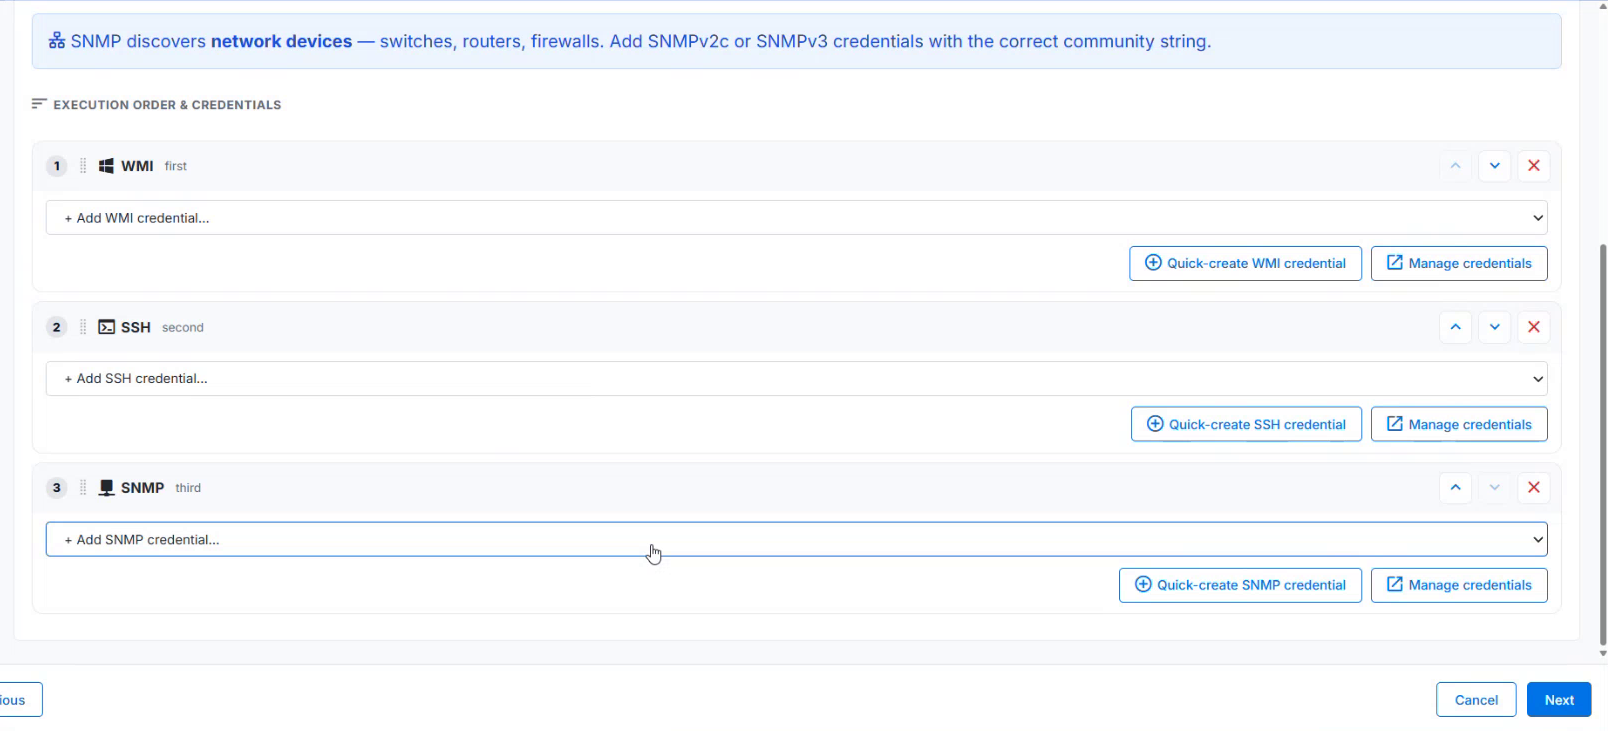
Figure: Protocol execution order and credentialsField Name
Description
WMI
Windows collection method. Select credentials that can access the intended Windows targets.
SSH
Linux collection method. Select the appropriate stored SSH credential.
SNMP
Network device collection method for targets such as switches, routers, and firewalls.
Add WMI / SSH / SNMP credential
Adds a stored credential to the corresponding method.
Quick-create credential
Opens a credential creation dialog for the method.
Manage credentials
Opens credential management.
Up and down arrows
Changes the method execution order displayed in the wizard.
Remove icon
Removes the corresponding method entry from the execution list.
Create WMI Credential
In the WMI entry, click Quick-create WMI credential.
Enter the credential name, username, and password.
Click Create & Add. Confirm that the credential appears under WMI.
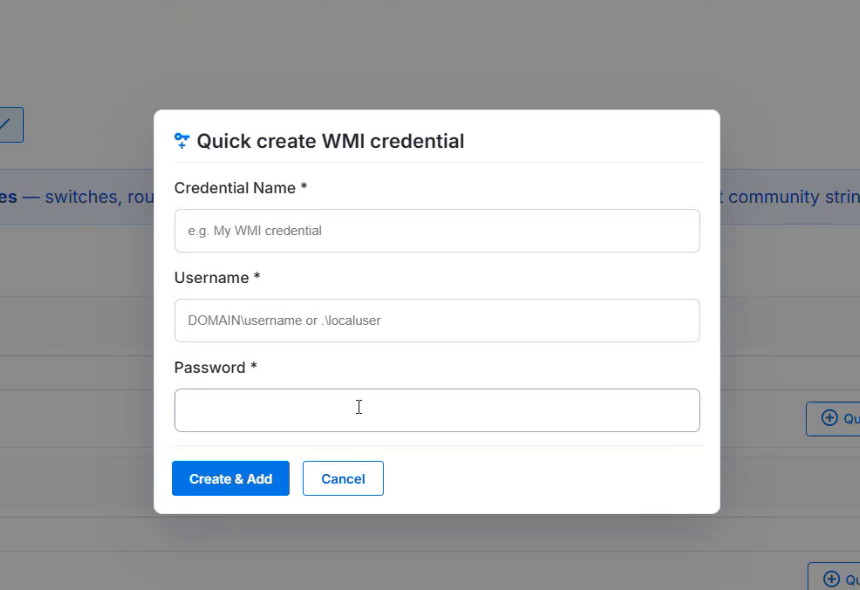
Figure: Create WMI credentialField or control
Description
Credential Name *
Recognizable label for the stored credential, such as HQ Windows Discovery.
Username *
Windows identity used for discovery. The dialog shows DOMAIN\username or a local username as examples.
Password *
Password for the specified account. Use the approved discovery account secret.
Create & Add
Creates the credential and adds it to the current job.
Cancel
Closes the dialog without completing credential creation.
Credential Selection Guidance
Choose WMI credentials for Windows targets, SSH credentials for Linux targets, and SNMP credentials for network devices. Match the SNMP version and security settings to the device configuration. The network guidance shown in the UI identifies SNMPv2c and SNMPv3 as credential options.
Use approved credential management procedures for account permissions, secret rotation, and testing. Avoid adding unrelated credentials to a job solely to increase the number of login attempts.
On Settings, select the collection depth needed for the job.
Review what the selected mode collects.
Scroll down to configure performance, data scope, and reachability options.
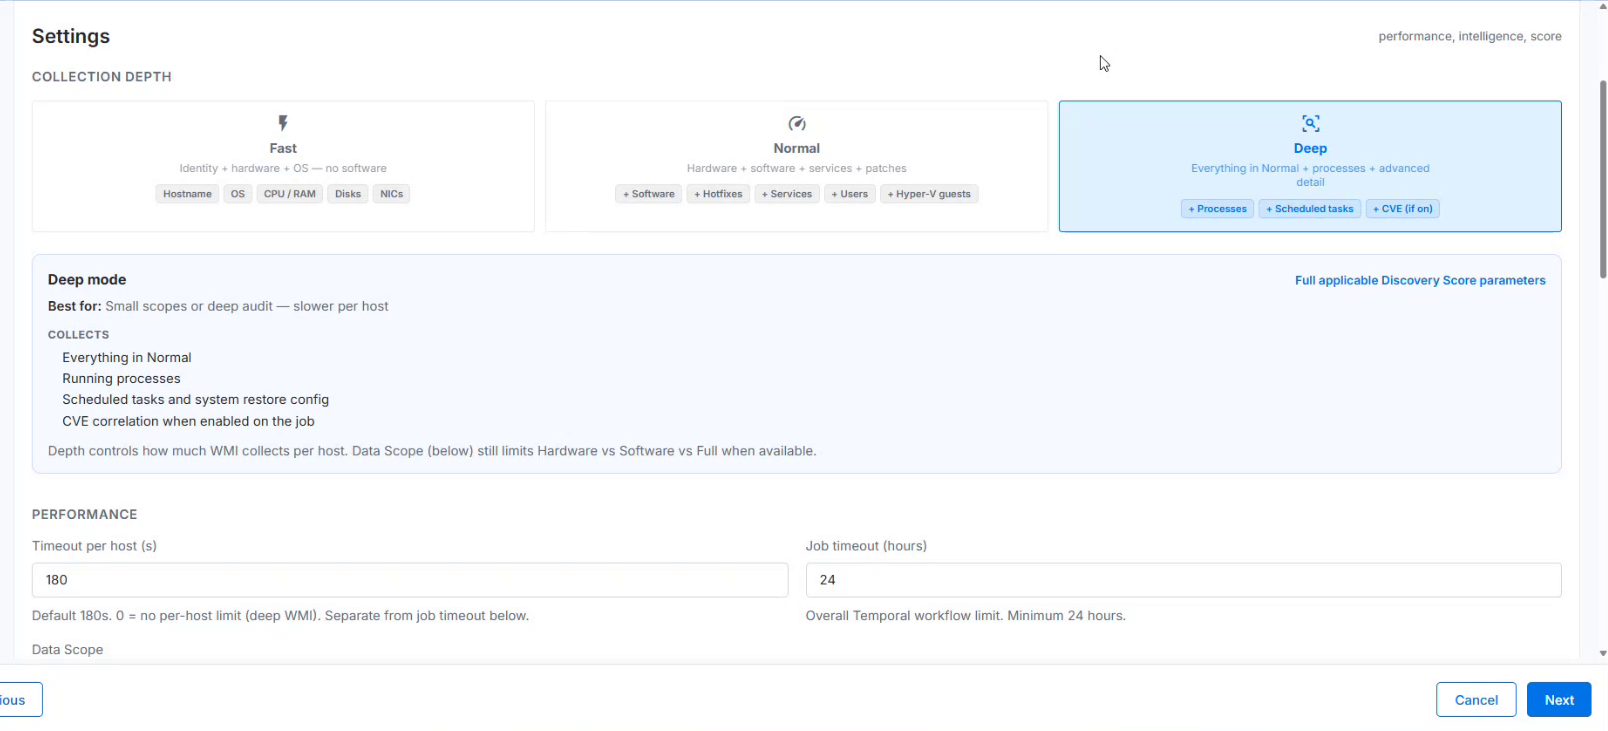
Figure: Settings | Collection depthCollection depth
Description
Fast
Collects identity, hardware, and operating system information without software. The screen lists hostname, OS, CPU/RAM, disks, and NICs.
Normal
Adds information such as software, hotfixes, services, users, and Hyper-V guests to hardware collection.
Deep
Adds running processes, scheduled tasks, system restore configuration, and CVE correlation when enabled. The UI identifies it as suitable for small scopes or deep audits and slower per host.
The visible helper text explains that depth controls how much WMI collects per host. Data Scope separately limits hardware, software, or full collection when available. Select both deliberately; a deeper mode does not remove a data scope restriction.
Recommended starting point
Begin with a representative host and the collection depth required by the inventory task. Reserve Deep collection for situations where its additional data is needed and the scan window can accommodate the work.
Configure Performance and Reachability
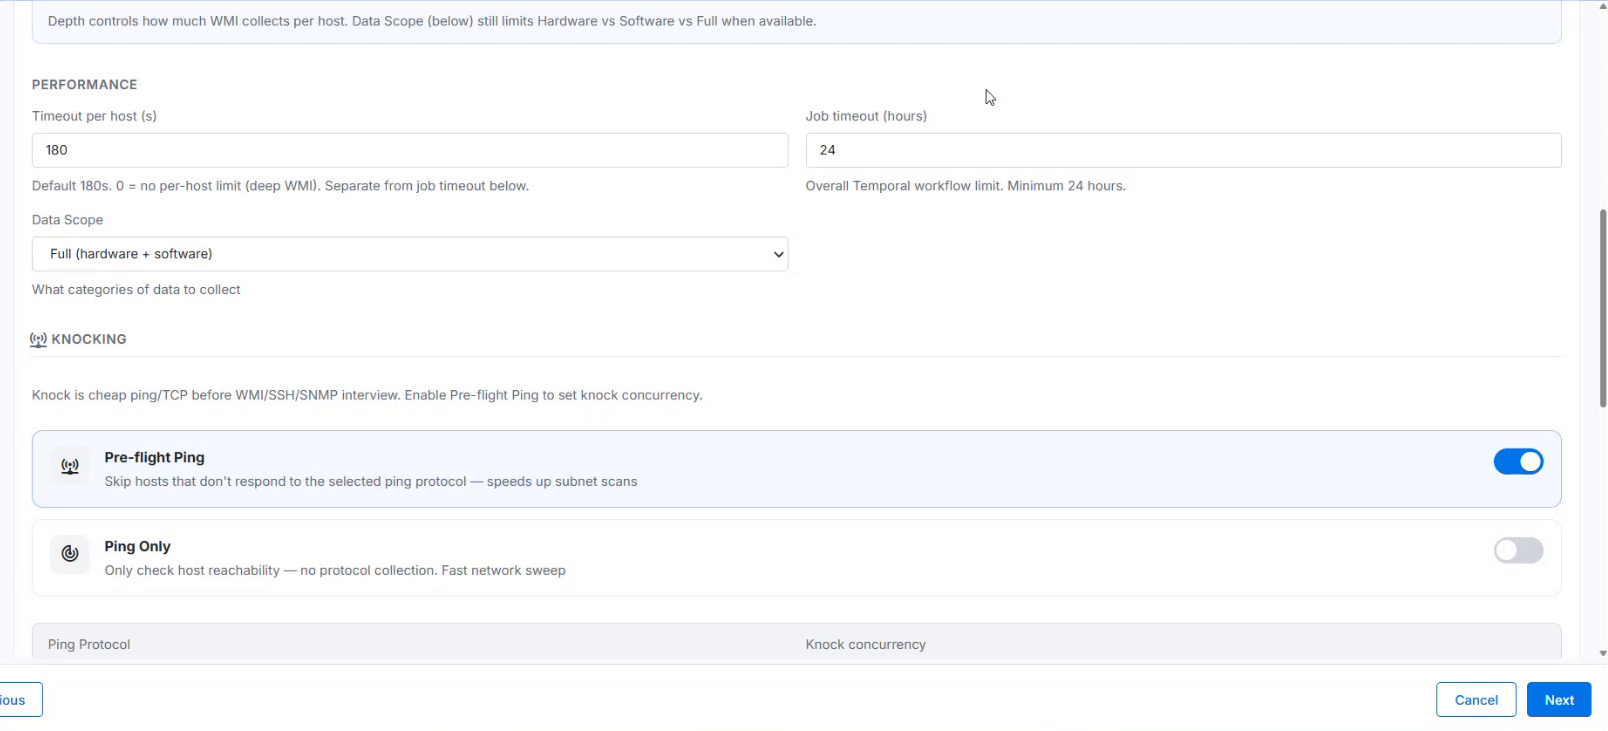
Figure: Performance and Reachability SettingsField name
Description
Timeout per host (s)
Time allowed per host. The UI shows 180 seconds and states that 0 removes the per-host limit for deep WMI. This is separate from the job timeout.
Job timeout (hours)
Overall Temporal workflow limit. The visible helper text specifies a minimum of 24 hours.
Data Scope
Categories of information to collect. The selected value shown is Full (hardware + software).
Pre-flight Ping
Checks reachability before protocol collection and skips hosts that do not respond to the selected ping protocol.
Ping Only
Checks host reachability without collecting protocol data. Use for a network sweep, not a detailed inventory.
Reachability Decision: Use a reachability method that your network permits. A target that does not respond to ICMP may still provide a discovery protocol. Investigate the network policy before treating a failed pre-flight check as proof that a device is powered off.
This section of the Discovery job Settings screen controls how long discovery can run, how target reachability is checked, and how scan requests are managed. These settings help administrators balance inventory collection requirements with execution time and network capacity.
Before collecting information through WMI, SSH, or SNMP, the job can perform a preliminary reachability check. The screen labels this process Knocking.
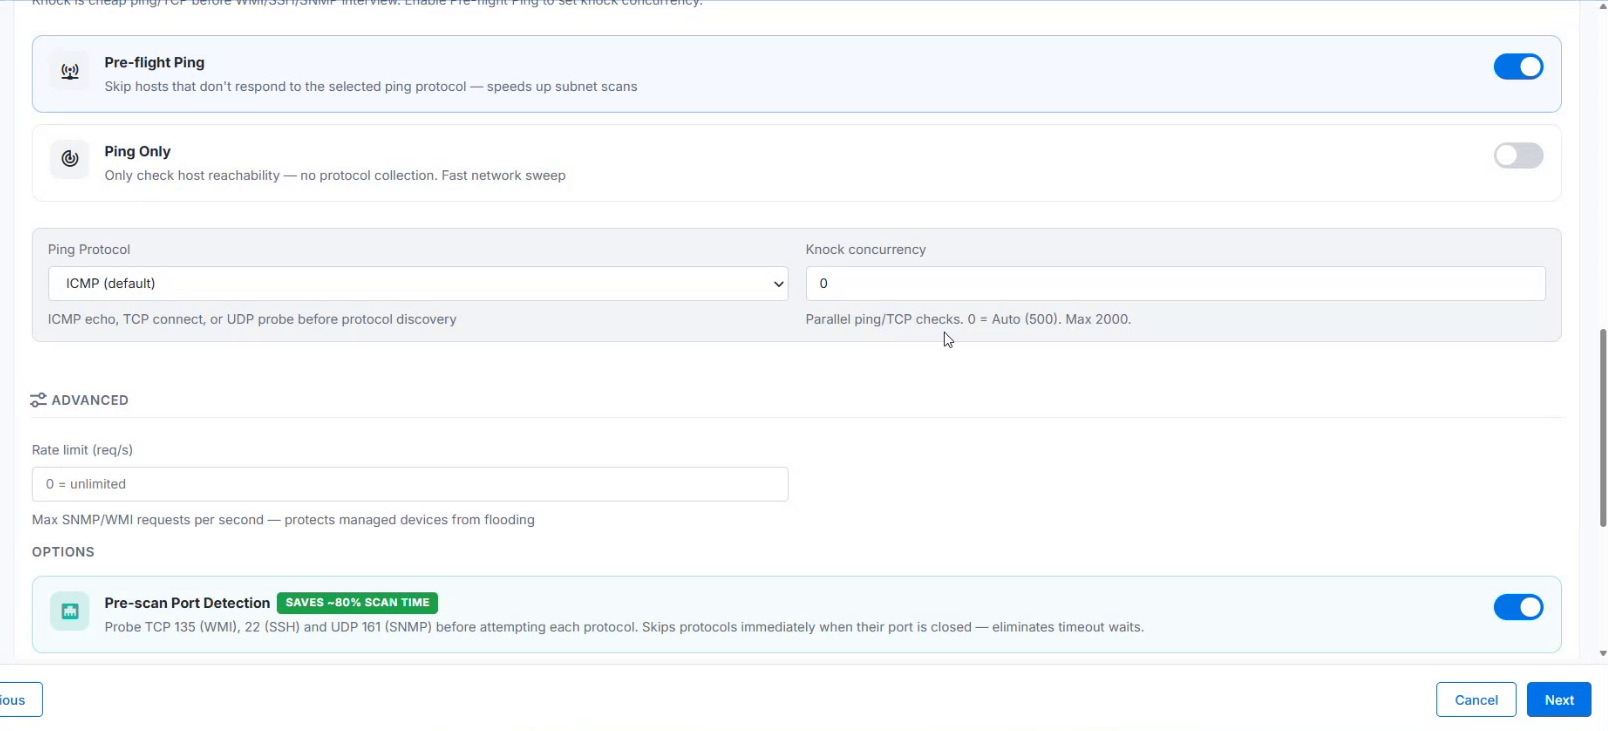
Figure: Knocking configurationField Name
Description
Timeout per host (s)
Specifies the time allowed for collection from an individual host. The displayed value is 180 seconds. For deep WMI discovery, 0 removes the per-host time limit. This setting is separate from the overall job timeout.
Job timeout (hours)
Specifies the overall execution limit for the Temporal workflow. The displayed value is 24 hours, which the screen identifies as the minimum.
Pre-flight Ping
Checks whether a target responds to the selected reachability protocol before attempting discovery. Hosts that do not respond are skipped. This option is enabled in the screenshot.
Ping Only
Checks host reachability without collecting inventory through WMI, SSH, or SNMP. Use this option for a reachability sweep. It is disabled in the screenshot.
Ping Protocol
Selects the method used for the preliminary reachability check. The displayed selection is ICMP (default). The helper text also identifies TCP connect and UDP probe methods.
Knock concurrency
Controls the number of parallel reachability checks. The displayed value, 0, selects Auto (500). The screen specifies a maximum of 2,000.
Rate limit (req/s)
Limits the number of discovery requests per second to help manage load on target devices. The screen indicates that 0 means unlimited.
These are collection settings shown in the demonstration, not a complete firewall specification. Have the infrastructure team validate the connectivity required by the selected protocol and deployment.
Recommended tuning sequence: Start with a small scope. Review duration, unreachable targets, and partial results. Adjust request rate, concurrency, or timeouts one at a time so you can assess the effect of each change.
Configuring scoring and diagnostic capture
Enable Coverage Score when you need to assess inventory completeness.
Enable the diagnostic capture options needed for operational review and support.
Enable CVE Correlation only after its prerequisite configuration is in place.
Click Next to open Schedule.
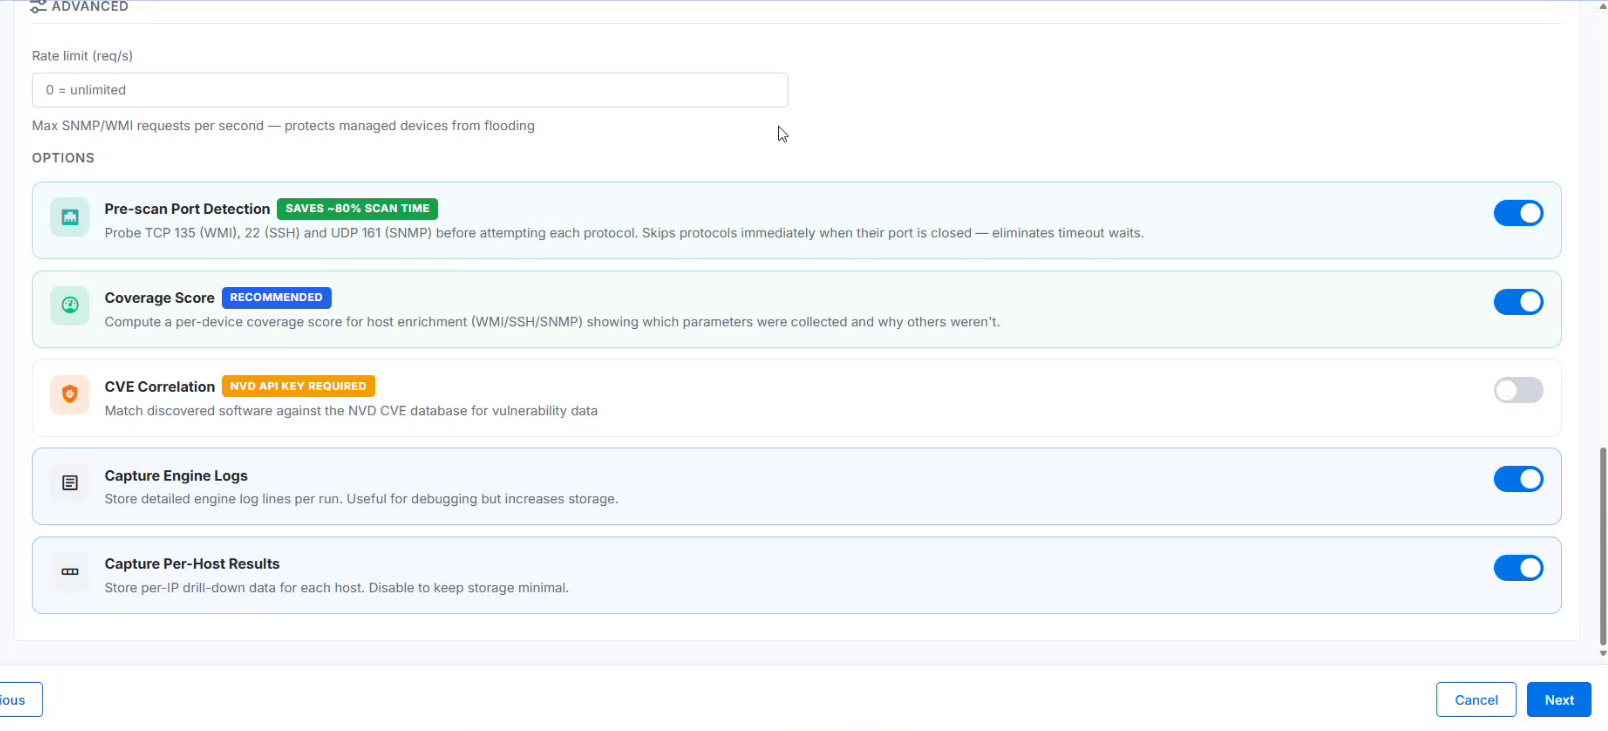
Figure: Scoring and diagnostic optionsField name
Description
Coverage Score
Calculates per-device collection coverage for WMI, SSH, and SNMP enrichment. Helps identify which parameters were collected and why others were not.
CVE Correlation
Matches discovered software against the NVD CVE database. The screen states that an NVD API key is required.
Capture Engine Logs
Stores detailed engine log lines for each run. Helps troubleshooting and increases storage use.
Capture Per-Host Results
Stores per-IP drill-down results for each host. The screen notes that disabling it can reduce storage.
During initial implementation, keep enough diagnostic detail to verify host outcomes. After the job is stable, review capture and retention requirements with the team responsible for storage and support.
Execution and Scheduling: You can run the job using either Temporal Worker or using Discovery Engine. If you opt for Discovery Engine, it will not use the worker.
Select the execution option supported by your deployment.
For Temporal Worker, choose a worker with access to the target network. Check the Effective task queue carefully.
For an immediate validation run, leave Enable scheduled runs off and click Create & Run Now.
For recurrence, enable Enable scheduled runs and configure the interval supported by your deployed release. Verify its time basis and save behavior before activating the recurring job.
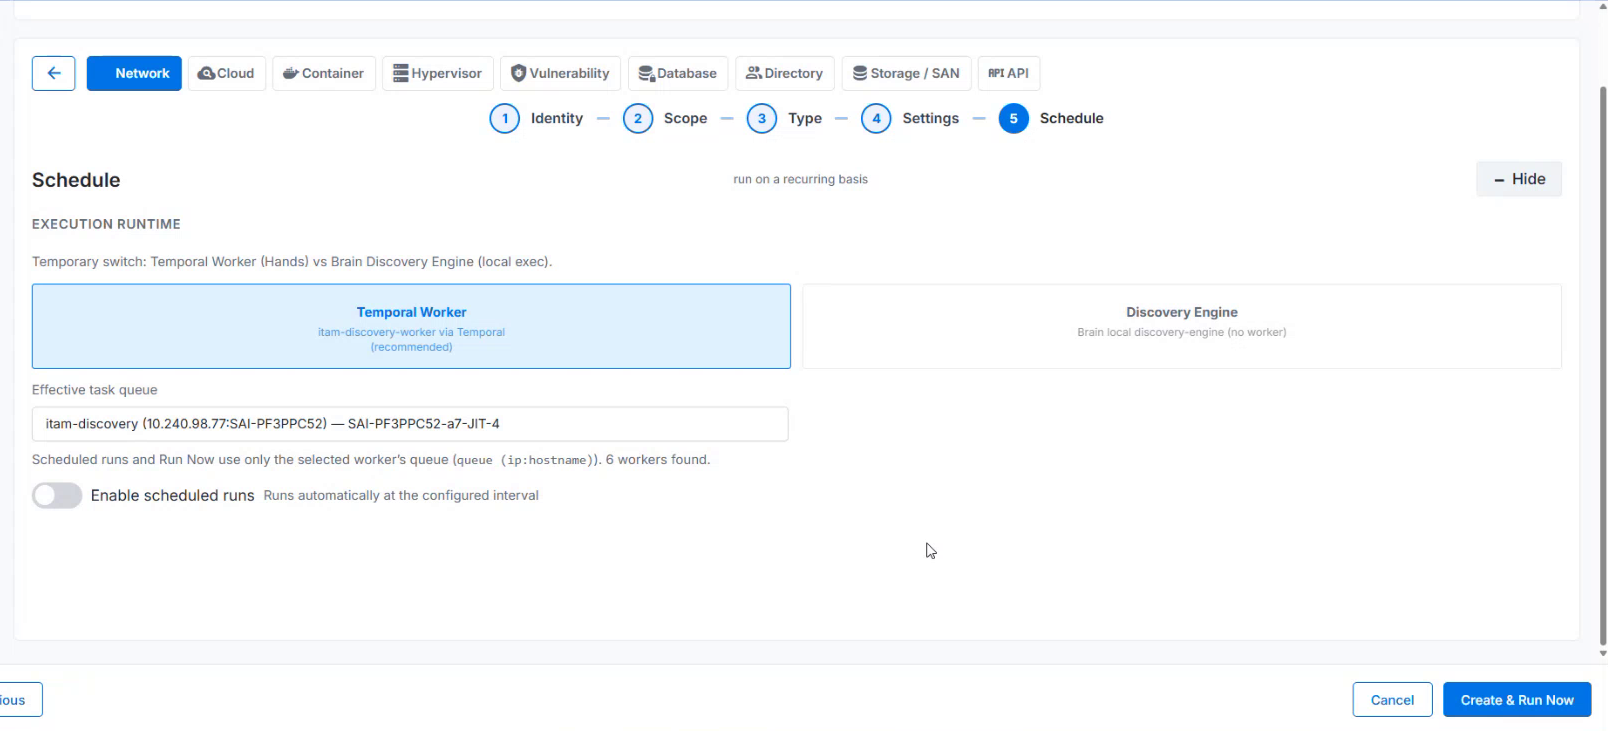
Figure: Scheduling and ExecutionField or control
Description
Temporal Worker
Executes through the discovery worker and Temporal. This option is selected and marked recommended in the UI.
Discovery Engine
Alternative local execution option shown in the demonstration.
Effective task queue
Selects the worker queue used for execution. The helper states that both scheduled runs and Run Now use only the selected worker queue.
Worker search
Searches the available worker entries when the queue selector is expanded.
Enable scheduled runs
Turns recurring execution on or off. The helper describes automatic runs at the configured interval.
Create & Run Now
Creates the job and starts an immediate run. The button is shown while scheduled runs are off.
Once you click Scan and Run Now, you will get a message mentioning Job started.
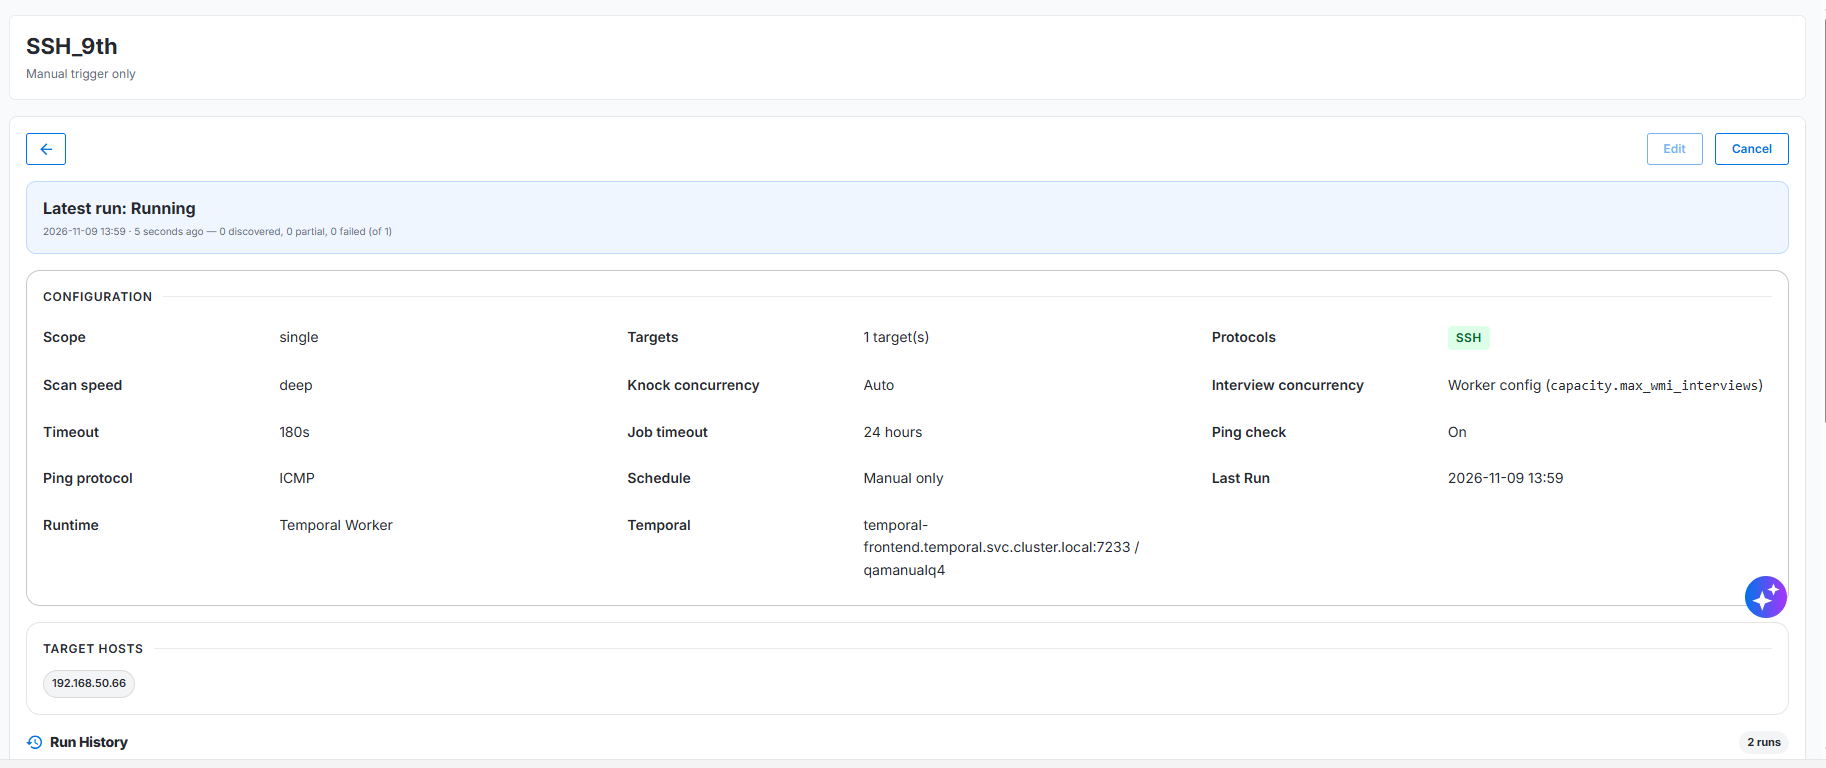
Figure: Job saved successfully
Apply the workflow to Windows and Linux
Use case 1 Validate Windows inventory
Scenario: An administrator needs to verify collection for a newly provisioned Windows server before including it in a wider inventory job.
1. Create a Network job named HQ Windows Validation. Select the correct tenant and Active status.
2. Choose Single Host / IP and enter the approved server address.
3. Select WMI and add a suitable Windows credential.
4. Choose Normal when software and service inventory is needed, or Fast for basic hardware and OS validation.
5. Set Data Scope to match the required inventory, and retain diagnostic capture for the test.
6. Select the worker that can reach the server. Leave recurrence off and click Create & Run Now.
7. Open the job details and inspect the host outcome. Verify the device record and coverage before expanding the scope.
Expected outcome: The host has a successful collection result and the required data appears in Discovered Devices. A completed run alone is not sufficient evidence of successful collection.
Use case 2 Inventory a Linux host group
Scenario: An implementation engineer needs to collect inventory from an approved set of Linux systems.
1. Create a Network job named Branch Linux Inventory.
2. Select IP List (multiple) and enter the approved hostnames or addresses.
3. Select SSH and add the stored SSH credential suitable for these hosts.
4. Choose the available data and diagnostic options required by the task. WMI-specific collection depth descriptions should not be assumed to define SSH collection.
5. Select a reachable worker and perform an immediate validation run.
6. Check SSH outcomes, collected device data, and failures before enabling recurring runs.
Expected outcome: The intended Linux hosts are discovered with the information supported by SSH collection in the deployed release.
Apply the workflow to network devices
Use case 3 Discover routers and switches
1. Create a Network job named Branch Network SNMP.
2. Use a host list, IP range, or CIDR subnet containing the approved devices. Add exclusions where applicable.
3. Select SNMP and add credentials matching the device version and security configuration.
4. Set the request rate and reachability options to suit the network and device capacity.
5. Select a worker with access to the network devices, then run a small test immediately.
6. Review SNMP outcomes and device records. Investigate timeouts or rejected credentials before expanding or scheduling the scan.
Use case 4 Discover a mixed subnet
1. Create a Network job for the approved subnet and define exclusions.
2. Select the applicable WMI, SSH, and SNMP methods and add credentials for each.
3. Arrange the displayed method order. Avoid enabling methods that have no relevant targets.
4. Choose collection and diagnostic options, select a worker, and validate an immediate run.
5. Review results by protocol and investigate the failed or partial hosts.
Plan recurring execution
Device group | Illustrative cadence to agree with owners |
|---|---|
Windows and Linux inventory | Daily outside busy hours when daily freshness is required. |
Routers and switches | Daily or weekly according to the required refresh rate and network policy. |
Deep Windows audits | Weekly or on demand for a small, controlled scope. |
Reachability sweeps | A shorter interval only when operationally justified and validated for network load. |
These frequencies are planning examples, not application defaults or verified scheduler choices. Confirm the actual recurrence controls, interval units, timezone, and overlap behavior in the deployed release. Check a subsequent automatic run to verify that recurrence is working.
Monitor execution and run history
The demonstration includes a completed run with 30 discovered, 1 partial, 34 failed, and 189 unreachable hosts out of 254 targets. This illustrates why run completion and host success must be reviewed separately.
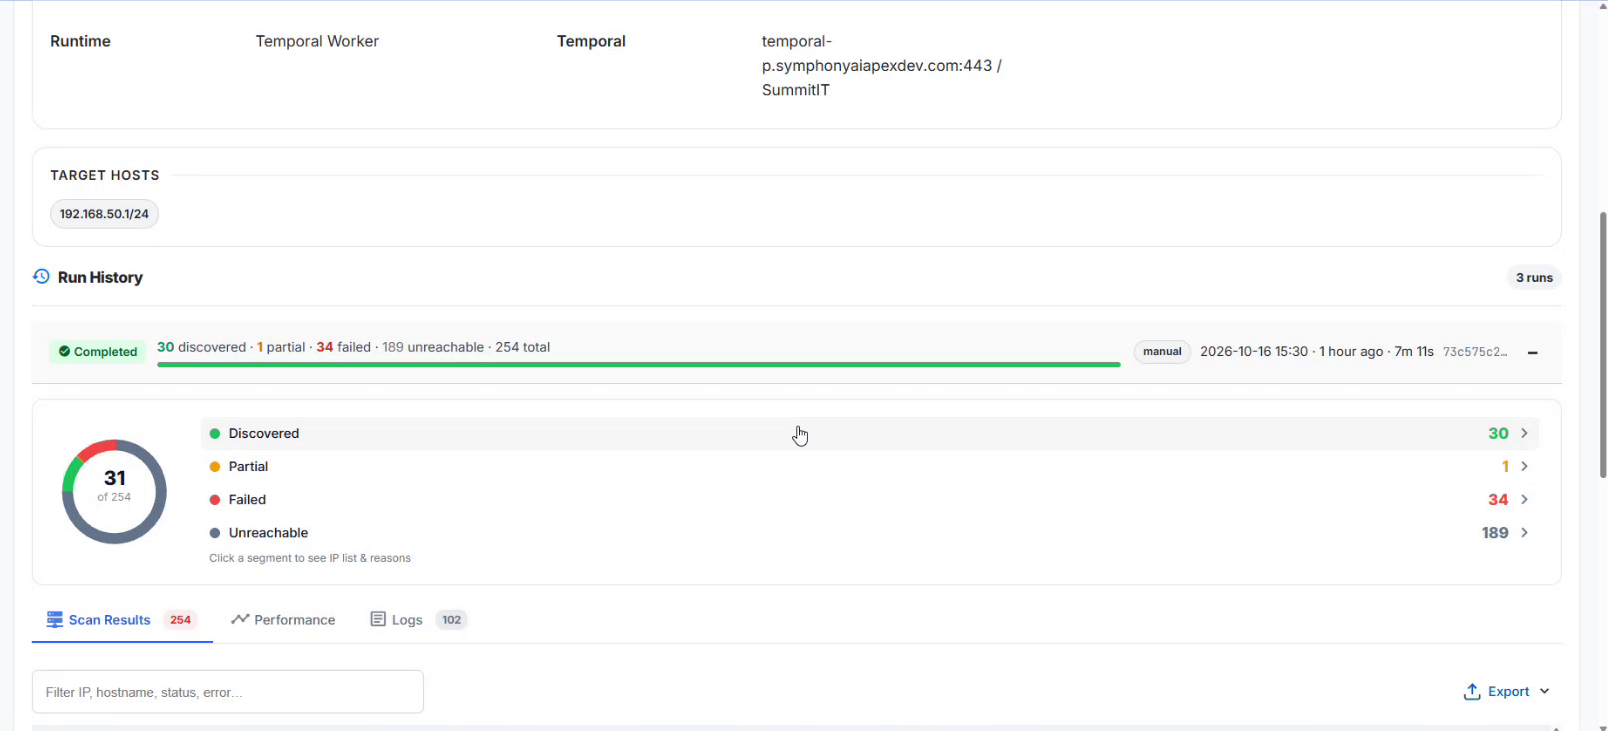
Figure: Job details and run history
1. Return to Jobs and open the relevant job name.
2. Review the configured runtime and target hosts.
3. Expand the run history entry that you want to inspect.
4. Review Discovered, Partial, Failed, and Unreachable counts. Click a count or chart segment to open the corresponding host list.
Field or control | Description |
|---|---|
Runtime | Execution mechanism associated with the job. |
Target Hosts | Target definition used by the job. |
Run History | Previous executions, including their state, time, duration, and outcome counts. |
Discovered | Hosts shown as successfully discovered for the run. |
Partial | Hosts for which collection is incomplete. Investigate details and coverage. |
Failed | Hosts with a collection failure. Review the recorded reason. |
Unreachable | Hosts classified as unreachable for the run. Investigate reachability checks and connectivity. |
Scan Results / Performance / Logs | Views for host outcomes, execution information, and diagnostic log entries. |
Inspect host results and logs
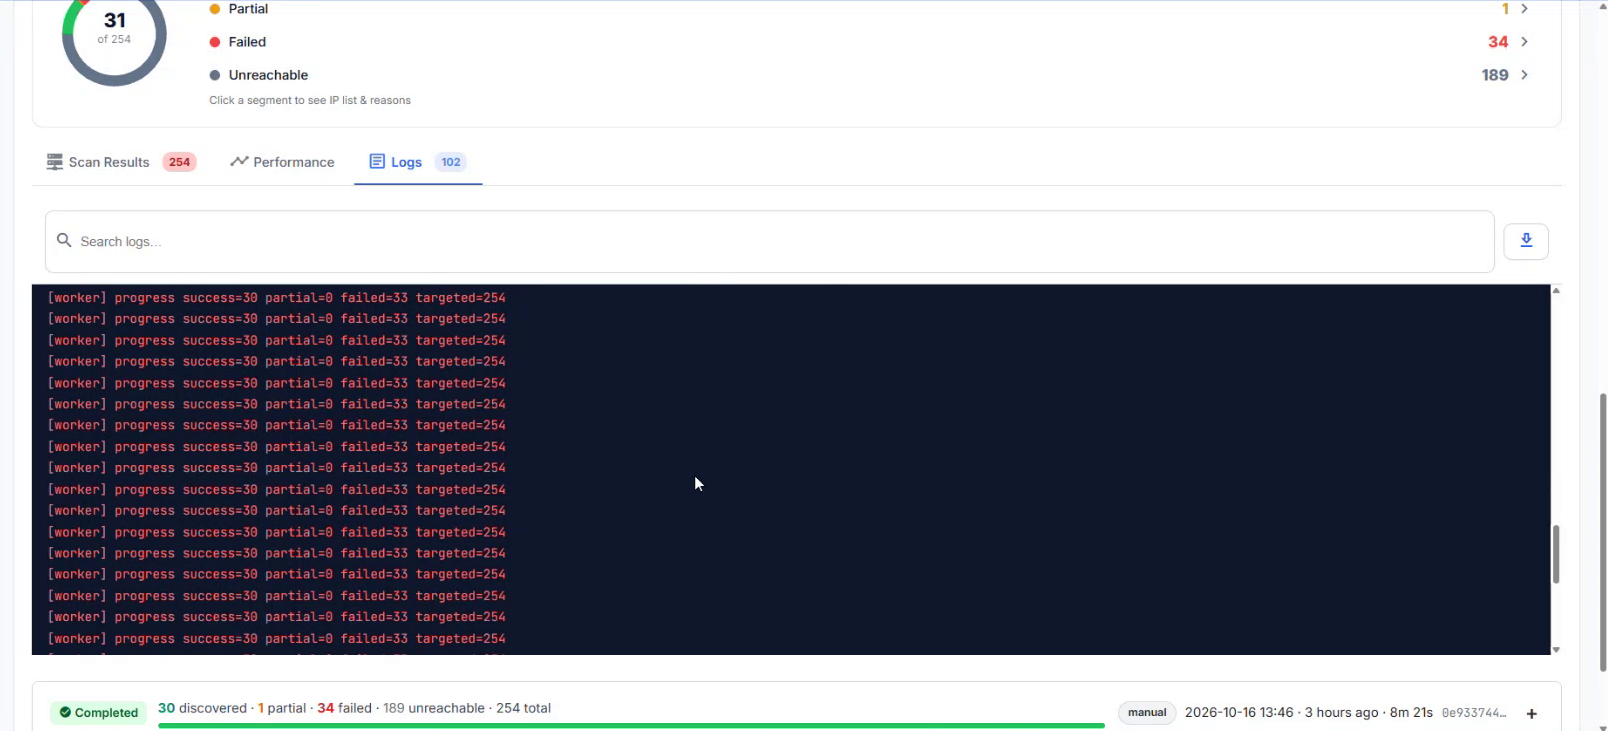
Figure: Run logs
1. In the selected run, open Scan Results to inspect individual targets.
2. Filter by IP address, hostname, status, or error text.
3. Review the protocol, outcome, duration, and failure reason for affected hosts.
4. Open Logs for detailed execution messages. Use Performance when reviewing execution behavior.
5. Use Export where available to preserve results for support analysis.
Field or control | Description |
|---|---|
Target IP | Address of the scanned host. |
Hostname | Hostname reported or displayed for the target. |
Protocol | Collection method used for the host result. |
Status | Host-level outcome, such as success, failed, or down. |
Duration | Elapsed time shown for the host collection attempt. |
Failure Reason | Diagnostic explanation for unsuccessful collection. |
Filter IP, hostname, status, error | Filters the scan results. |
Search logs | Finds relevant diagnostic entries in the log view. |
Export | Exports the displayed result information through the available control. |
Verify discovered devices and coverage
Discovery and asset mapping are separate checks. A device may be successfully discovered while its mapping status remains Not mapped. Review your asset mapping configuration when inventory records must be created or linked.
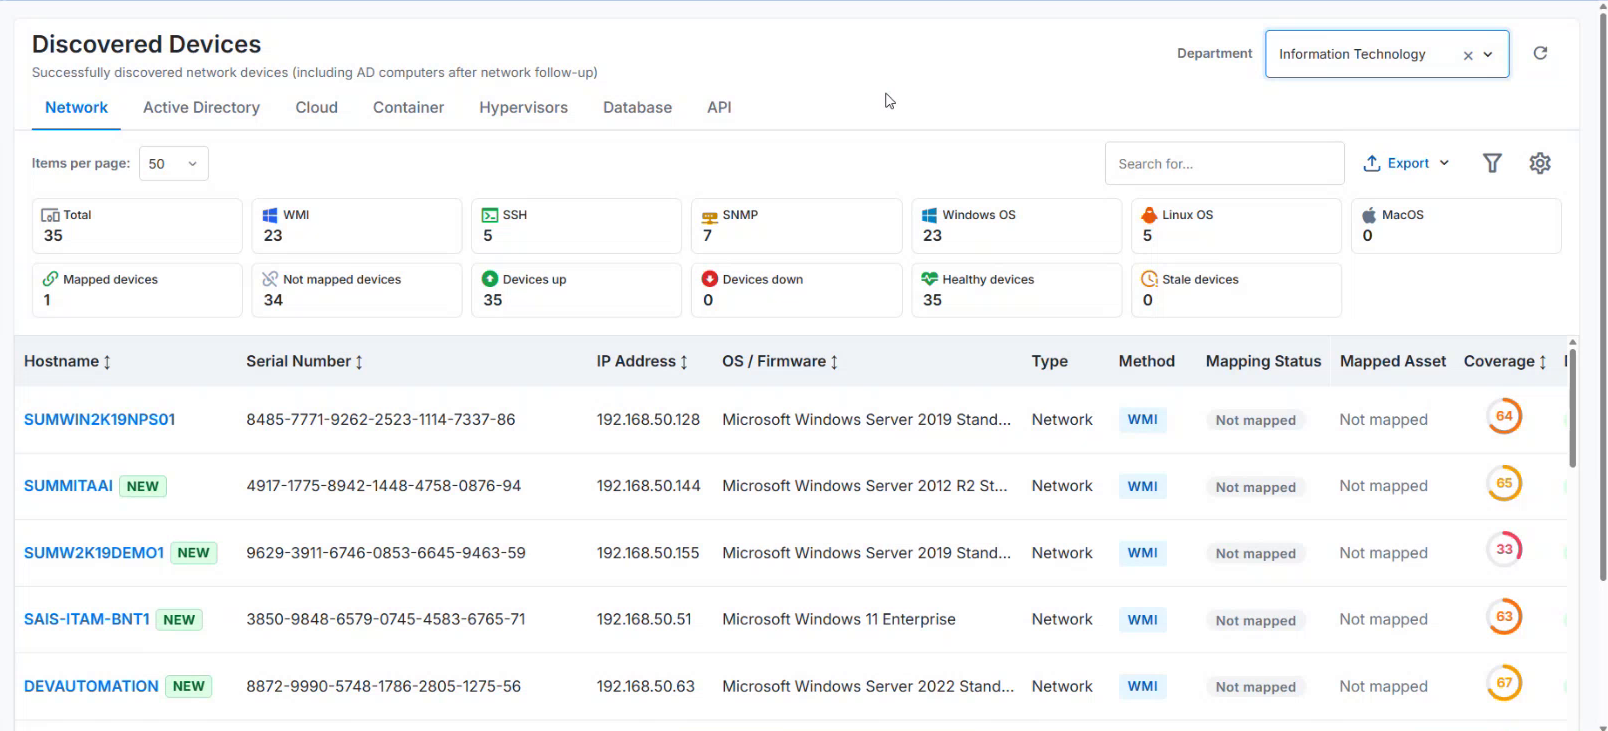
Figure: Discovered Devices
1. Open Discovered Devices.
2. Select the source tab, such as Network, and locate the target host.
3. Confirm its identity and discovery method.
4. Review mapping status and coverage. Open the device to inspect the collected data.
Field or control | Description |
|---|---|
Department / source tabs | Scopes results to the relevant department and discovery source. |
Hostname / Serial Number / IP Address | Device identity information used to locate and verify a discovered device. |
OS / Firmware | Operating system or firmware information collected for the device. |
Type / Method | Device discovery category and collection method. |
Mapping Status / Mapped Asset | Shows whether the discovered device is associated with an asset and the linked asset where applicable. |
Coverage | Indicates collection completeness for the device. |
Device Status | Shows the device availability state where the column is displayed. |
Review device collection detail
Open a discovered device and expand Discovery Score to inspect data coverage by category. This helps distinguish a basic successful connection from complete collection of the data your team needs.
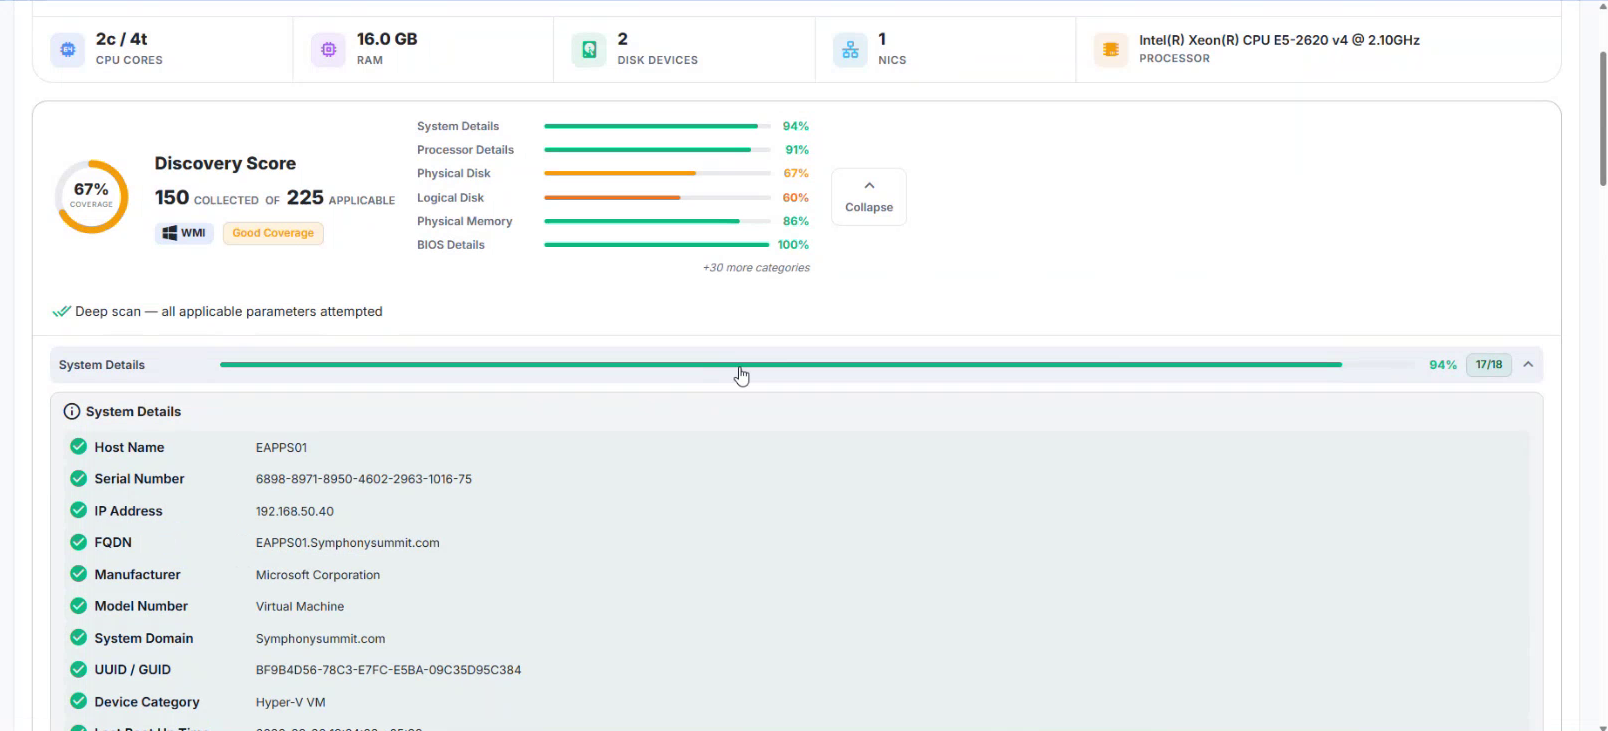
Figure: Device Discovery Score
Field or control | Description |
|---|---|
Discovery Score | Device-level measure of collection coverage. The display shows the collected and applicable parameter counts. |
Category bars | Break down collection completeness by categories relevant to the device type. |
Overview | Summarizes device identity, resources, and discovery information. |
Hardware / Software / Network | Provides collected technical information where applicable to the device. |
Changes | Shows recorded attribute changes, including old and new values where available. |
Vulnerabilities | Provides vulnerability information where supported and configured. |
Raw | Provides a raw-data view for detailed inspection. |
Use the categories applicable to the device. A network switch, Windows server, printer, and cloud resource can expose different data. A coverage score is not an asset mapping status or a guarantee that every possible attribute exists.
Best practices
Keep scopes controlled
Start with one representative host per device group and protocol.
Split large environments into jobs that reflect network boundaries and ownership.
Review subnet calculations and exclusions before a broad scan.
Avoid overlapping jobs that collect the same targets unnecessarily.
Match collection to the business need
Use Fast collection for basic Windows identity and hardware checks.
Use Normal when standard software and service inventory is required.
Use Deep for a targeted audit when the extra detail justifies the duration.
Check Data Scope as well as collection depth.
Keep Ping Only off when the goal is detailed inventory.
Plan schedules and capacity together
Measure a successful run before selecting a recurring interval.
Allow enough time for the normal run duration and agreed operating window.
Review the deployed scheduler behavior for concurrent or overlapping runs.
Distribute work across available workers that can reach the relevant networks.
Check the first automatic execution after enabling or changing recurrence.
Maintain credentials and diagnostics
Use approved discovery accounts with the permissions needed for collection.
Update stored credentials when secrets change and validate a small test run.
Retain enough per-host detail and logs to investigate failures.
Review diagnostic storage and retention after implementation stabilizes.
Track failed and partial hosts, device coverage, and inventory freshness over time.
Troubleshoot discovery and execution
The corrective steps below are operational recommendations. Confirm changes with the relevant system or network owner and validate against a small target set before expanding the job.
Symptom | Checks and corrective action |
|---|---|
Job remains queued or never starts | Check the selected worker queue, worker connectivity, and last-seen information. Review Discovery-Worker View and orphaned-job findings. Correct the worker assignment or restore the worker, then retry. |
Recurring execution does not occur | Check Enable scheduled runs, the saved interval, the job state, and Schedule health. Confirm timezone and overlap behavior for the deployed release. Check worker availability and verify a subsequent automatic run. |
Host shows down or ICMP timeout | Confirm the target address and network route from the worker. Determine whether the chosen reachability protocol is permitted. If policy blocks it, select a supported check or review the pre-flight setting with the network owner. |
WMI reports ACCESS_DENIED | Verify the selected account, password, and domain or local username format. Ask the Windows owner to validate remote WMI access and applicable permissions. Update the stored credential and retry one host. |
SNMP times out | Check target reachability, device SNMP configuration, the credential version and security settings, and network access from the worker. Validate one known device before rerunning the full scope. |
SSH collection fails | Confirm the SSH service is reachable from the selected worker. Review the selected credential, supported authentication configuration, and account permissions. Use the host failure reason to narrow the cause. |
Run completes with failed hosts | Open the run history and inspect Failed and Unreachable lists. Completion indicates that the execution ended; it does not establish that every target was collected. |
Results are partial or coverage is low | Check the selected data scope and collection mode, permissions, timeouts, and device-specific category coverage. Inspect missing parameters before changing collection settings. |
Troubleshoot data quality and support cases
Symptom | Checks and corrective action |
|---|---|
Hardware appears but software is missing | Check whether Fast mode or a hardware-focused Data Scope was selected. For Windows, use a collection mode and scope that include software, then verify permissions and rerun a test. |
Only reachability information is available | Check whether Ping Only is enabled. Disable it when protocol collection is required and verify that the appropriate methods and credentials are configured. |
No per-host diagnostic detail exists | Check Capture Per-Host Results and Capture Engine Logs. Enable suitable diagnostic capture for a controlled subsequent run and inspect the newly captured data. |
Scan takes longer than expected | Review scope size, Deep collection, per-host timeout, unreachable targets, and worker capacity. Consider a smaller scope or lighter mode. Use pre-scan checks and measured rate or concurrency changes. |
Target expected in scope is absent | Verify its address, selected scope, and exclusions. For host lists, use valid separators. Check the selected worker and whether pre-flight checks skipped the host. |
Discovered device is Not mapped | Verify the device in Discovered Devices, then review asset mapping configuration. Successful discovery does not automatically establish an asset association. |
CVE information is absent | Check CVE Correlation, prerequisite NVD API key configuration, and whether the required software data was collected. Verify the feature configuration with the deployment owner. |
Data Parse / Protocol Error repeats | Open the failure details and capture the affected host, protocol, and error. Preserve diagnostic logs and escalate if a corrected configuration still reproduces the issue. |
Information to include in a support case
Provide the tenant or department, job name and identifier if available, affected run time and timezone, selected worker and queue, target address and device type, method, failure reason, collection settings, and relevant exported results or logs. Include recent credential or network changes. Do not include passwords, private keys, or SNMP secrets.
Validate the correction
Retry one affected host or a small representative set. Confirm successful collection, the expected device attributes, and the next automatic run when recurrence is in use. Record the change and outcome before applying it to the larger job.
Implementation verification and screen reference
Verification checklist
The intended tenant or department, targets, and exclusions are correct.
Each device group has an appropriate method and selected credentials.
The chosen worker can reach the targets and process the selected queue.
Collection depth, data scope, and timeouts match the inventory requirement.
An immediate test run provides the expected device data.
Failed, partial, and unreachable outcomes have been investigated.
The recurring interval and time basis have been checked in the deployed release.
The next automatic run is observed and reviewed.
Asset mapping is checked separately where required.