The Discovery Intelligence dashboard provides a consolidated view of discovery health, job performance, failures, inventory freshness, coverage, workers, credentials, and discovered inventory for the selected Department. Use the dashboard to identify discovery issues, review their impact, and take corrective action from a single page.
The dashboard uses live discovery data and highlights items that require attention, such as failed devices, repeated failures, stale devices, schedule gaps, offline workers, unhealthy credentials, and recently failed jobs.
Key Benefits
View discovery health, job performance, and inventory status in one dashboard.
Identify failures and review affected devices, jobs, and likely causes.
Monitor inventory freshness, discovery coverage, and schedule health.
Check worker availability and credential health to guide follow-up actions.
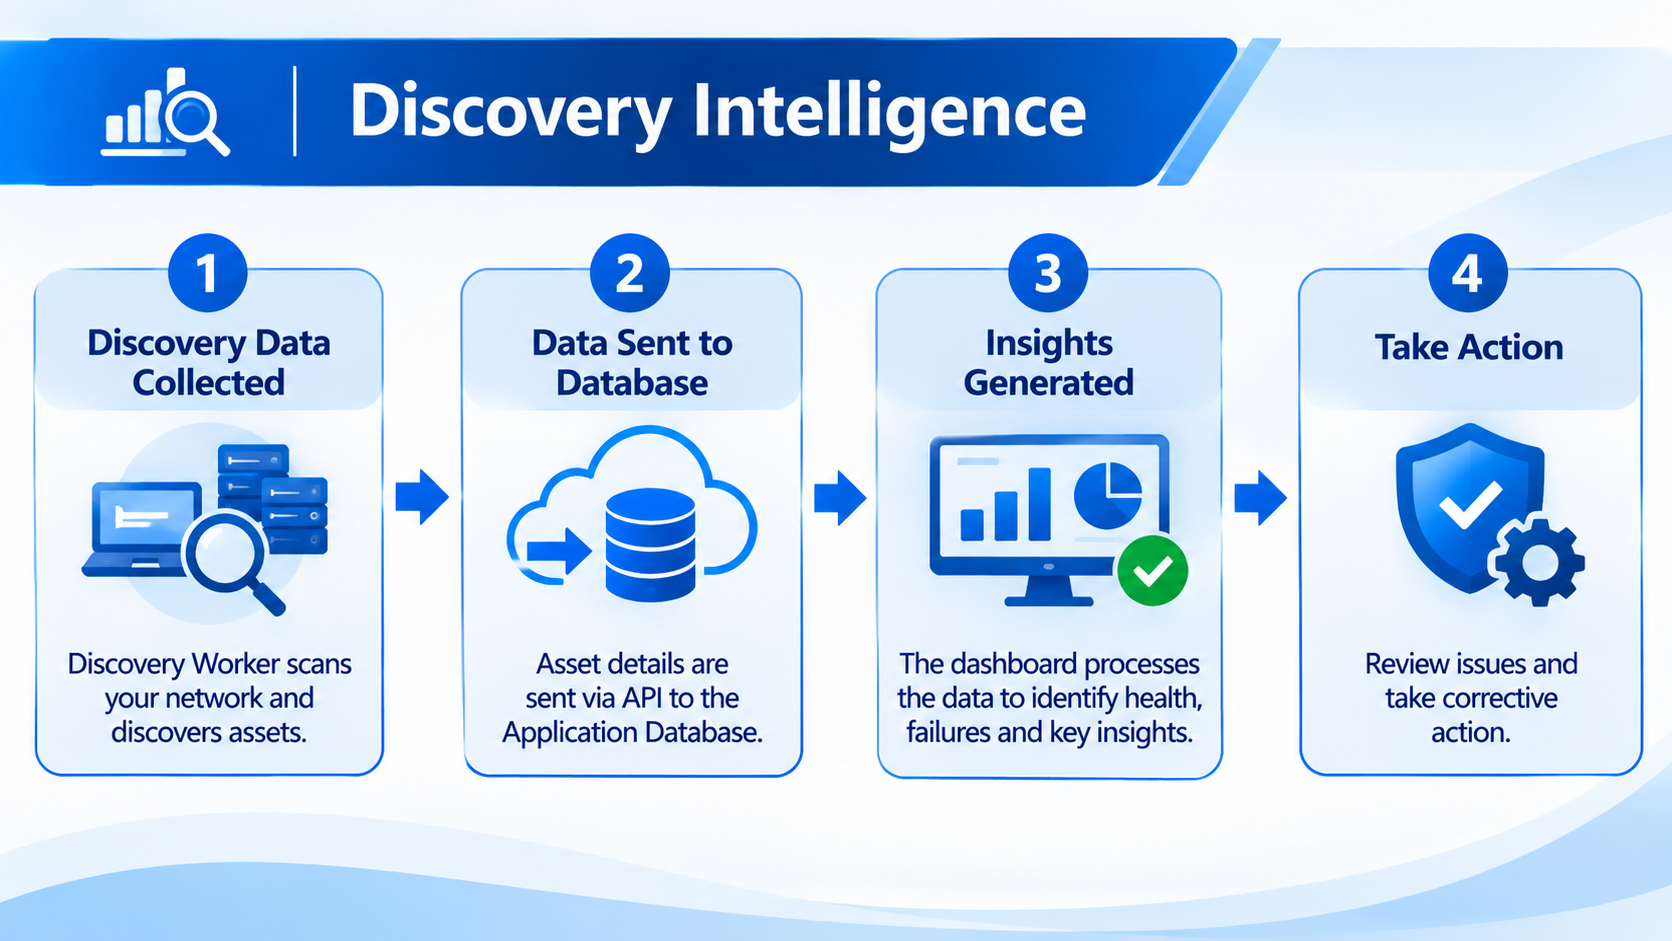
Use Case User Persona: Admin | Solution |
|---|---|
NovaTech Technologies manages IT, Human Resources, and Finance across its locations. Its administrator needs to identify discovery problems quickly and understand which devices, jobs, or teams require attention. | NovaTech uses the Discovery Intelligence dashboard to review discovery health and take action from a department-level view. How NovaTech uses Discovery Intelligence?
|
1. View Discovery Intelligence
Use the dashboard to review discovery health and investigate items that need attention. The displayed intelligence reflects the selected department’s discovery data.
To access the dashboard, perform the following steps:
Navigate to ITAM > Asset > Discovery > Discovery Intelligence.
Select the required Department from the dropdown to view the Discovery Intelligence for that particular Department. If you select Information Technology as Department then the intelligence gets displayed for Information Technology.
Review the Discovery Intelligence dashboard.
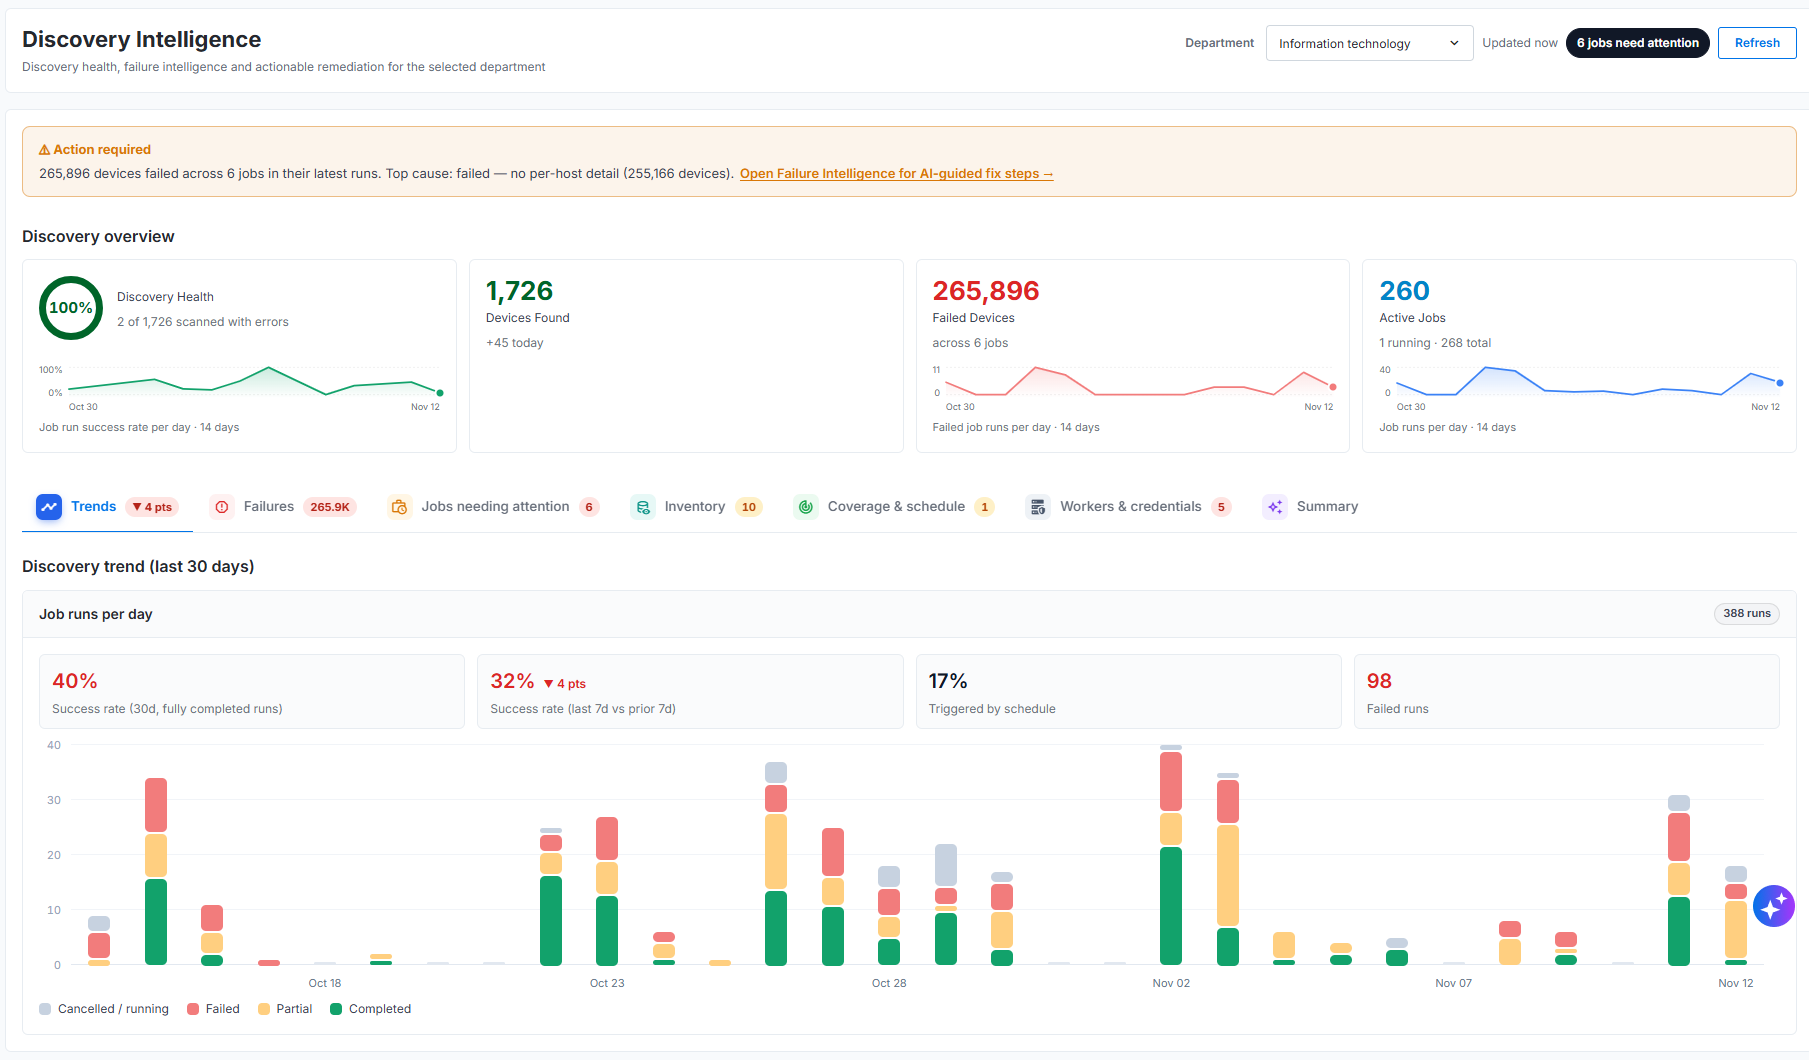
Figure: Discovery Dashboard
The page header shows when the dashboard data was last updated, the number of jobs that need attention, and the Refresh action. Select Refresh to retrieve the latest dashboard data.
The dashboard organizes its details into the following tabs. Select a tab to view its related discovery information:
Tab | Information |
|---|---|
Trends | Discovery health, inventory activity, failed devices, active jobs, and job-run trends. |
Failures | Failure causes, job-run health, and hosts with repeat failures. |
Jobs needing attention | Discovery jobs with recent device failures, their run history, and available actions. |
Inventory | Inventory freshness, discovery sources, device updates, protocols, and operating systems. |
Coverage & schedule | Discovery coverage gaps and schedule health. |
Workers & credentials | Discovery worker availability, job assignments, and credential health. |
Summary | A consolidated view of discovery health, failures, job runs, inventory, and collection methods. |
2. Action required
When discovery issues require attention, the dashboard displays an Action required notification at the top of the page. The notification summarizes:
The number of devices that failed in the latest job runs.
The number of affected jobs.
The most common failure cause and the number of devices affected by that cause.
The recommended next step, such as expanding Failure Intelligence for AI-guided remediation.
3. Discovery overview
The Discovery overview section provides a high-level view of discovery activity and health.
3.1 Discovery Health
The Discovery Health intelligence provides a consolidated view of discovery performance. It helps administrators determine how many scanned devices completed discovery successfully, how many completed with errors, and whether the success rate is improving or declining over time.
 Figure: Discovery Card
The card displays the following:
Discovery Health percentage: Shows the percentage of scanned devices for which discovery completed without errors.
Devices scanned with errors: Shows the number of scanned devices that encountered one or more errors during discovery.
Total scanned devices: Shows the total number of devices included in the discovery runs.
Job-run success-rate trend: Displays the daily discovery job-run success rate for the last 14 days. Hover over a point in the graph to view the success rate for a specific date.
Example
In the example shown, the overall Discovery Health is 100%. Of the 1,724 scanned devices, 2 devices completed with errors. The trend graph shows the daily job-run success rate for the last 14 days. For example, the success rate on November 3 was 13%.
The overall health percentage and the daily job-run success rate represent different measurements. The overall percentage summarizes device-level discovery health, while the graph shows the percentage of discovery jobs that completed successfully on each day. As a result, the intelligence can show 100% Discovery Health even when the success rate for a specific day is lower.
3.2 Devices Found
The Devices Found intelligence displays the total number of devices currently available in the discovered inventory. This count includes devices identified across completed discovery runs.
The intelligence also displays the number of devices newly added to the discovered inventory on the current day. This value helps administrators understand the daily change in the inventory.
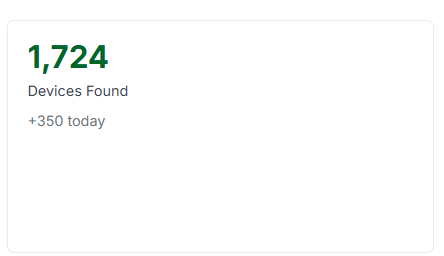
Figure: Devices Found
Example
In the example shown 1,724 is the total number of devices available in the discovered inventory. +350 today indicates that 350 devices were newly discovered and added to the inventory today.
The total of 1,724 devices includes the +350 added today; it’s not a separate count. For example, if the inventory contained 1,374 devices before today, adding 350 newly discovered devices results in a total of 1,724 devices.
3.3 Failed Devices
The Failed Devices intelligence shows the total number of devices that encountered errors during recent discovery job runs. Use this intelligence to understand the extent of device-level discovery failures and identify dates with a higher number of failed job runs.
The card displays the following:
Failed Devices: The total number of devices that the discovery jobs could not scan or process successfully.
Jobs with failures: The number of discovery jobs in which one or more devices failed.
Failed job-run trend: The number of job runs with device failures for each day during the last 14 days.
Date-specific details: Hover over a point in the graph to view the date and the number of failed job runs recorded on that date.
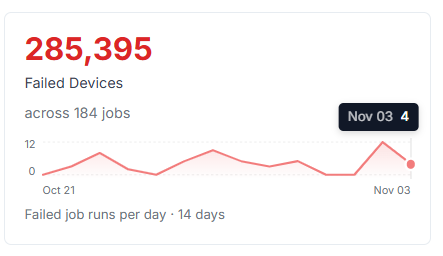
Figure: Failed Devices
Example
285,395 devices encountered discovery errors.
The device failures occurred across 184 discovery jobs.
The graph shows the daily number of job runs that contained device failures during the last 14 days.
Hovering over the last point shows Nov 03: 4, which means that 4 discovery job runs recorded device failures on November 3.
The failed-device count and the failed-job count represent different measurements. A single discovery job can contain failures for many devices. With 285,395 failed devices across 184 jobs, those 184 jobs collectively recorded 285,395 device failures.
3.4 Active Jobs
The Active Jobs intelligence shows the number of discovery jobs that are currently enabled and available to run based on their configured schedules. Use the intelligence to understand the overall volume of active discovery configurations and monitor how many times discovery jobs run each day.
The card displays the following:
Active Jobs: The number of enabled discovery jobs.
Running jobs: The number of discovery jobs currently in progress.
Total jobs: The total number of discovery jobs, including active and inactive jobs.
Job-run trend: The number of discovery job runs initiated each day during the last 14 days.
Date-specific job runs: Hover over a point in the graph to view the date and the number of job runs recorded on that date.
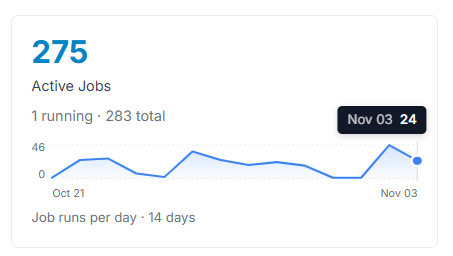
Figure: Active Jobs
Example
275 discovery jobs are active.
1 discovery job is currently running.
283 discovery jobs exist in total. This means that 8 jobs are not active.
The graph shows the daily number of job runs during the last 14 days.
Hovering over the last point shows Nov 03: 24, which means that discovery jobs ran 24 times on November 3.
The number of active jobs and the number of job runs represent different measurements. An active job can run many times based on its configured schedule. With, 275 active jobs do not mean that 275 jobs run every day.
4. Trends
The Trends tab summarizes discovery health, inventory activity, failed devices, and active jobs. Review the 30-day job-run chart to compare run outcomes and spot changes in discovery performance.
4.1 Discovery trend
The Discovery trend (last 30 days) section provides a day-by-day view of discovery job runs during the previous 30 days. Use this section to assess the overall job-run success rate, compare recent performance with the preceding period, understand what triggered jobs, and identify dates with a higher number of partial, failed, cancelled, or running jobs.
The number in the upper-right corner shows the total number of job runs recorded during the 30-day period. A discovery job can run more than once during this period. This value represents job runs, not the number of configured discovery jobs
 Figure: Discovery Trend
4.1.1 Discovery trend summary
The summary cards display the following information:
Success rate (30d, fully completed runs): Shows the percentage of all job runs that completed successfully during the last 30 days. Only fully completed runs contribute to this success rate. Partial, failed, cancelled, and running jobs are not counted as successful runs.
Success rate (last 7d vs prior 7d): Shows the success rate for the most recent seven days and compares the result with the preceding seven days. The point change indicates whether the success rate increased or decreased between the two periods.
Triggered by schedule: Shows the percentage of job runs started automatically according to a configured schedule. Other supported trigger methods started the remaining runs.
Failed runs: Shows the total number of job runs that ended with a Failed status during the 30-day period.
Job runs per day
The Job runs per day stacked bar chart shows the number and status of discovery job runs recorded on each day. Each bar represents one day, and each colored segment represents a job-run status:
Completed: Job runs that completed successfully.
Partial: Job runs that completed but did not process all expected discovery data successfully.
Failed: Job runs that ended with a failure.
Cancelled / running: Job runs that users cancelled or that were still running when the system calculated the trend data.
The total height of each bar represents the total number of job runs for that day. A taller bar indicates more discovery activity. The size of each colored segment shows how many runs ended with the corresponding status.
Hover over a bar to view the following:
Date of the job runs.
Number of runs in each status.
Percentage that each status contributes to the day’s total.
Total number of job runs recorded on that date.
Example
The following table explains the discovery trend values shown for the last 30 days:
Metric | Value | Description |
|---|---|---|
Total job runs | 386 | Discovery recorded 386 job runs during the last 30 days. |
30-day success rate | 41% | 41% of the 386 job runs completed successfully. |
Latest seven-day success rate | 32% | 32% of the job runs completed successfully during the most recent seven-day period. |
Change from the prior seven days | 7 points lower | The success rate decreased by 7 percentage points compared with the preceding seven-day period. The success rate for the prior period was 45%. |
Triggered by schedule | 17% | A configured schedule started 17% of the job runs. |
Failed runs | 98 | 98 job runs failed during the 30-day period. |
Hover over a bar in the chart to view the job-run details for the corresponding date.
For example, the tooltip for November 02, 2026 shows the following information:
Status | Job runs | Percentage of daily runs |
|---|---|---|
Completed | 17 | 68% |
Partial | 4 | 16% |
Failed | 3 | 12% |
Cancelled / running | 1 | 4% |
Total | 25 | 100% |
The chart can help identify dates with lower completion rates or an increase in partial and failed runs. For example, a larger red segment indicates that more job runs failed on that date and might require investigation.
5. Failures
The Failures tab groups device errors by cause and summarizes discovery job-run health. Review repeat failures to identify hosts with persistent issues and focus the investigation.
5.1 Failure Intelligence
The Failure Intelligence section groups failed devices by the reported failure cause and helps administrators identify, investigate, and resolve discovery failures. The total displayed in the intelligence represents the number of failed devices included in the analysis.
The chart shows how failed devices fall into each failure cause. Each cause displays the number of affected devices and its percentage of the total failed-device count. Use this information to focus on causes that affect the most devices.
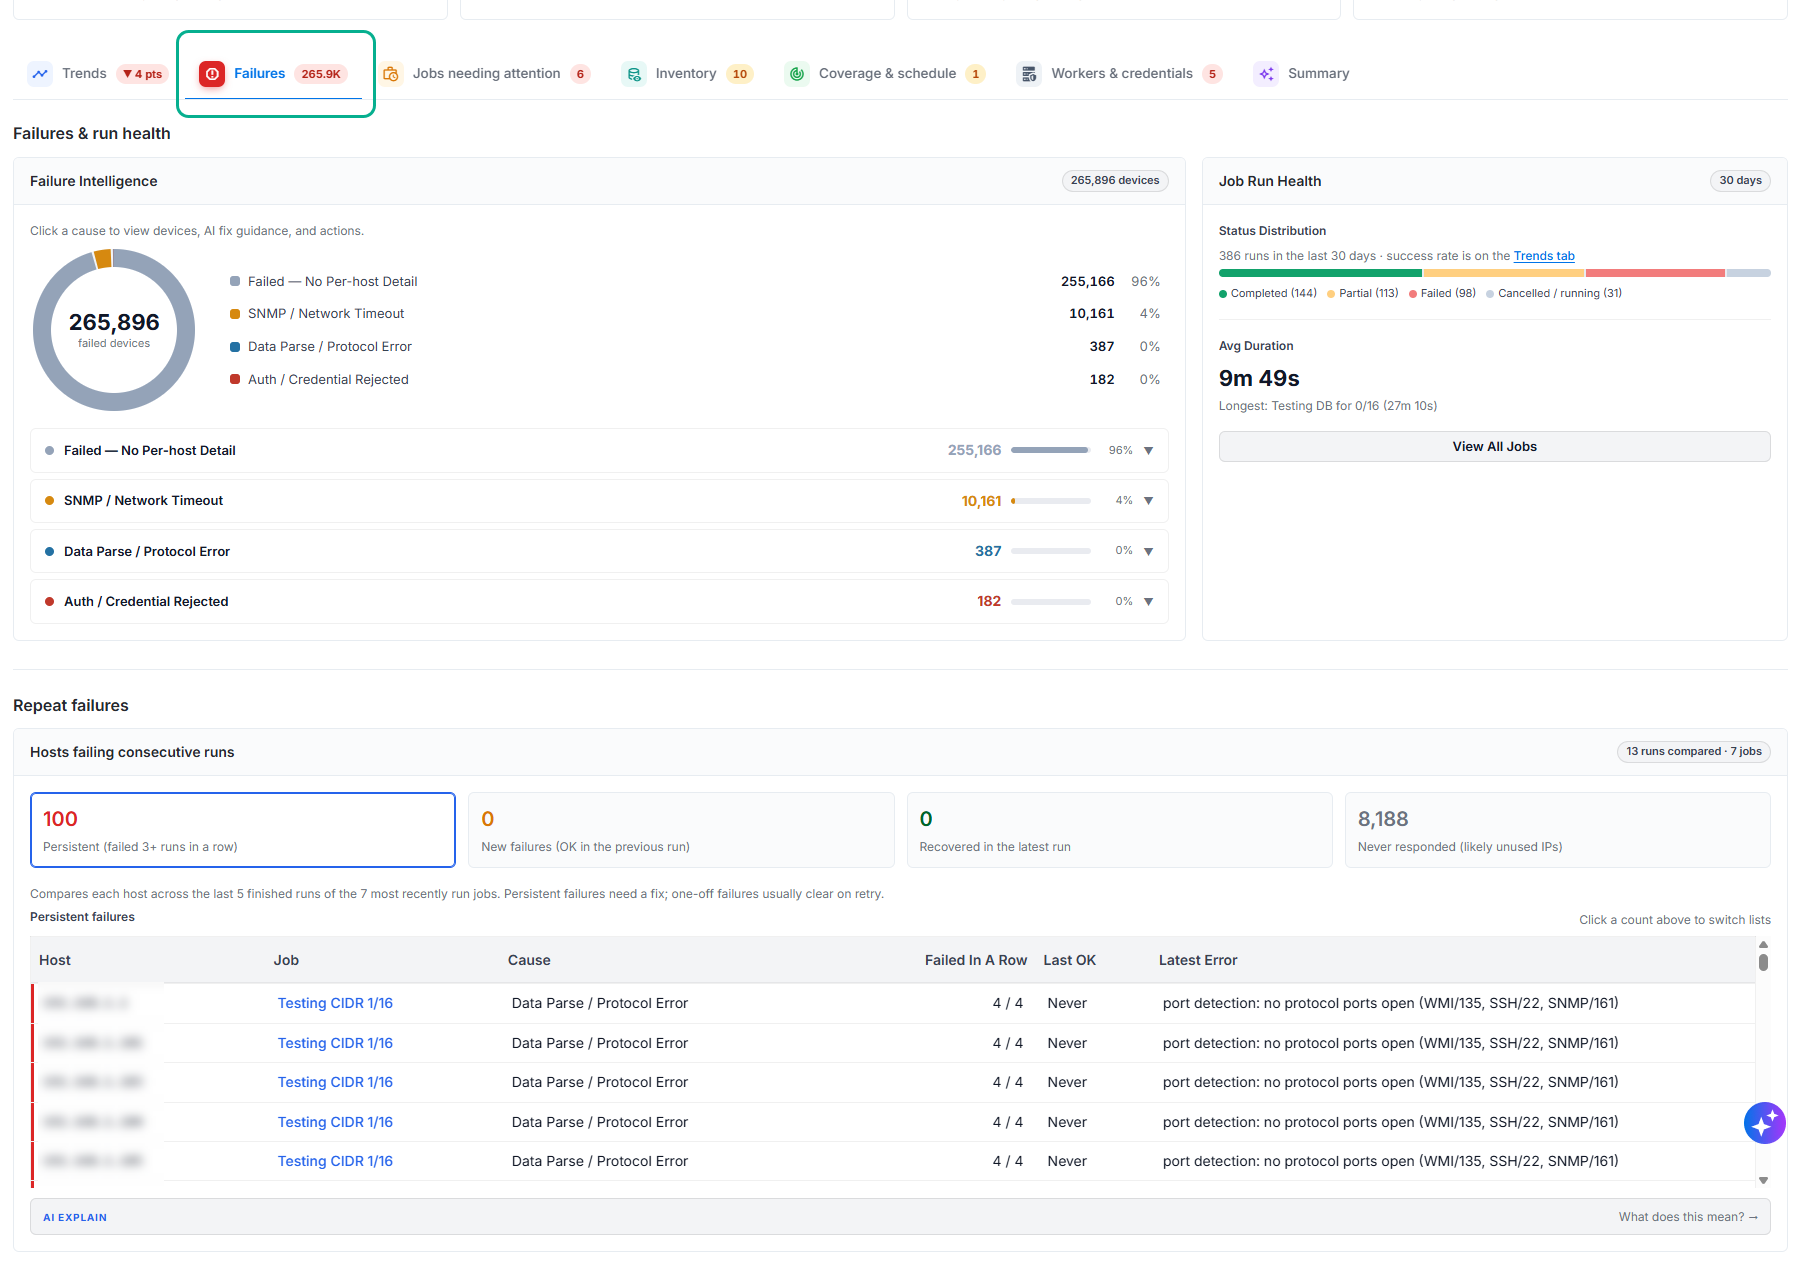
Figure: Failure Intelligence
The following failure causes can appear:
Failure cause | Description |
|---|---|
Failed — No Per-host Detail | The discovery run reported failures but did not store failure information for individual devices. Because per-host results are unavailable, the system cannot classify the failures under a more specific cause. |
SNMP / Network Timeout | The target device did not respond within the configured time. This can occur when a device is unreachable, a required port or protocol is unavailable, or the configured timeout is insufficient. |
Data Parse / Protocol Error | The system received a response but could not process it because the returned data or protocol response was invalid or unsupported. |
Auth / Credential Rejected | The target rejected the credentials used by the discovery job, or the account did not have the permissions required to collect discovery data. |
Select a failure cause to expand its details. The expanded section shows the affected jobs and the number of failures associated with each job. Select an affected job to review the failures recorded for that job.
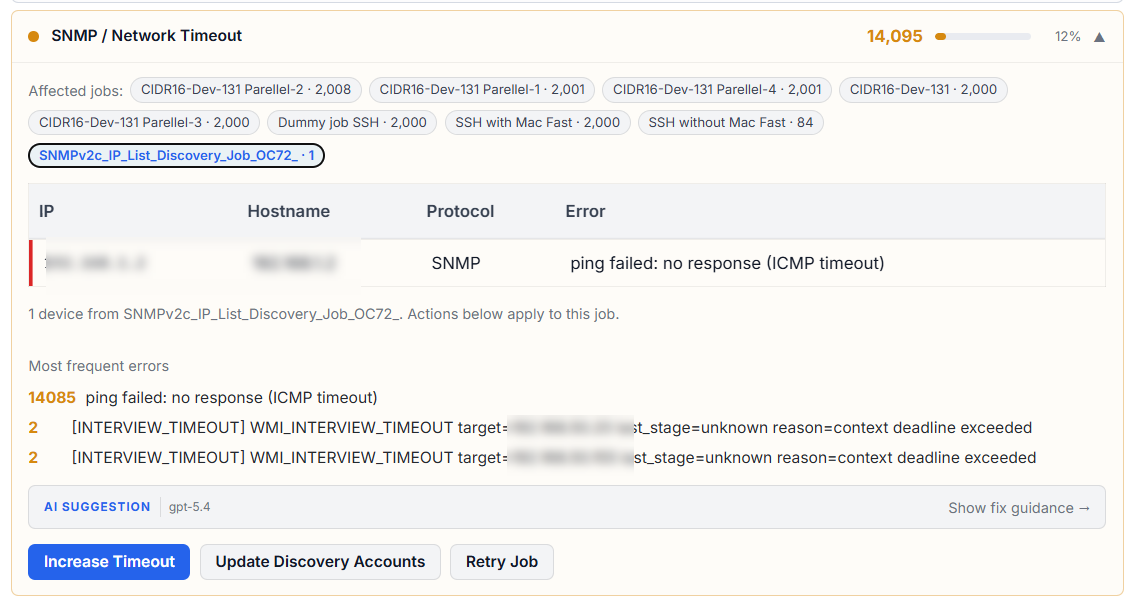
Figure: Failure Cause
The Most frequent errors section groups recurring error messages and shows how often each error occurred. Use this information to identify the error affecting the largest number of devices before taking corrective action.
5.1.1 AI fix guidance
Select Show Fix Guidance for a failure cause to generate troubleshooting guidance based on the available failure information.
 Figure: Show Fix Guidance
The system explains the likely cause of the failure, indicates its confidence level, and recommends actions to resolve the issue.
 Figure: AI Suggestion
After the system generates the guidance, select Hide to collapse it or Regenerate to generate updated guidance using the available failure data.
AI-generated guidance might vary based on the device-level details recorded during discovery. Review the suggested actions before updating the job configuration, discovery account, timeout, or other settings.
5.1.2 Failure actions
The available actions depend on the selected failure cause and the information recorded for the affected job. The intelligence displays only the actions relevant to that cause:
Failure cause | Actions | Description |
|---|---|---|
Failed — No Per-host Detail | Edit Job Settings and Retry Job | Opens the configuration page for the selected discovery job. Review settings such as per-host result collection, timeout, scan scope, or execution settings, then save before retrying. When you select Retry Job, the system runs the job and displays a success message on the page. |
SNMP / Network Timeout | Increase Timeout, Update Discovery Accounts, Retry Job | Increase Timeout opens the job configuration so you can increase the timeout. Update Discovery Accounts opens the discovery account configuration to review or update credentials and account settings. Retry Job starts a new run of the selected job. A status notification confirms that it has started and is running. Refresh the page after the run completes to view the latest results. |
Data Parse / Protocol Error | Review Discovery Extensions, View Job Results, Retry Job | Review Discovery Extensions opens the discovery extensions for review. View Job Results opens the selected job’s results. Retry Job starts a new run of the selected job; a status notification confirms that it has started and is running. Refresh the page after the run completes to view the latest results. |
Auth / Credential Rejected | Update Discovery Accounts, Retry Job, View Job Results | Update Discovery Accounts opens the discovery account configuration to review or update credentials and account settings. Retry Job starts a new run of the selected job; a status notification confirms that it has started and is running. View Job Results opens the selected job’s results. Refresh the page after the run completes to view the latest results. |
In the example shown, the SNMP / Network Timeout category contains 14,095 devices, representing 12% of the failed devices. Expand the failure cause to view the affected discovery jobs and the number of device failures reported by each job.
Selecting an affected job displays the available device-level information, including the IP address, hostname, protocol, and error message. For example, the selected job, SNMPv2c_IP_List_Discovery_Job_OC72_, contains one affected device. The job scanned the device using SNMP, and the reported error is ping failed: no response (ICMP timeout).
The Most frequent errors section summarizes recurring errors across the failure category. In this example, 14,095 failures occurred because the target devices did not respond to an ICMP ping. Two other error groups contain two WMI interview timeout failures each.
Select Show fix guidance under AI Suggestion to generate troubleshooting guidance for the selected failure. Based on the generated guidance, select Increase Timeout to update the job timeout, Update Discovery Accounts to review the account settings, or Retry Job to start a new run. The selected action applies to the currently selected job.
When you select Retry Job, the system starts a new run and displays its status. Refresh the page after the run completes to view the latest discovery results.
5.2 Job Run Health
The Job Run Health intelligence summarizes the status and execution time of discovery job runs during the displayed period. Use this intelligence to understand the distribution of run outcomes, compare successful and unsuccessful runs, and identify jobs that take longer than expected to complete.
The period indicator in the upper-right corner shows the time range included in the card. The status counts represent individual job runs, not the number of configured discovery jobs. A discovery job can run many times during the selected period, and each execution contributes separately to the total.
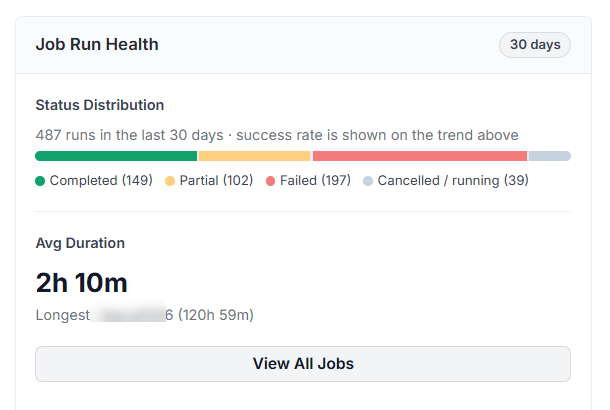
Figure: Job Run Health
5.2.1 Status Distribution
The Status Distribution section shows the total number of discovery job runs and groups the runs by their final or current status. The color-coded bar represents the relative proportion of each status.
Status | Description |
|---|---|
Completed | The job run completed successfully. |
Partial | The job run completed, but the system could not process some devices or discovery data successfully. |
Failed | The job run ended because of an error and did not complete successfully. |
Cancelled / running | Someone cancelled the job run, or it remained in progress when the system calculated the intelligence data. |
The success rate is available in the Discovery trend section. The Job Run Health intelligence provides the status counts used to understand that trend.
5.2.2 Run duration
Avg Duration shows the average time taken by the job runs included in the displayed period. This value helps identify whether discovery runs generally complete within the expected time. Runs that are still in progress might not contribute a final duration until they complete.
Longest identifies the job run with the longest recorded duration during the period. The intelligence displays the job name and duration to help administrators locate runs that might require configuration or performance review.
Select View All Jobs to open the complete discovery jobs list for further review.
Example
In the example shown, discovery jobs ran 487 times during the last 30 days. The status distribution contains 149 completed runs, 102 partial runs, 197 failed runs, and 39 cancelled or running runs. These counts total 487 job runs.
The average duration of the job runs was 2 hours and 10 minutes. job-1 was the longest job run, with a duration of 120 hours and 59 minutes. A job with a longer duration than the average might have a large discovery scope, unreachable targets, repeated timeouts, limited worker capacity, or configuration settings that require review.
5.3 Repeat failures
The Repeat failures section identifies hosts that failed across consecutive discovery runs. Use this section to distinguish persistent problems that require corrective action from new failures and hosts that recovered in the latest run.
The analysis compares each host across the last five completed runs of the 20 most recently executed discovery jobs. The indicator in the upper-right corner shows the number of runs and jobs included in the comparison. The values might cover fewer than five runs for a host when the associated job has not completed five runs during the displayed period.
The summary cards group the hosts as follows:
Failure category | Description |
|---|---|
Persistent | Hosts that failed in at least three consecutive runs. These failures are recurring and might require changes to network access, credentials, discovery settings, or the job scope. |
New failures | Hosts that failed in the latest run but completed successfully in the previous run. These failures might be temporary or might reflect a newly introduced connectivity or configuration issue. |
Recovered | Hosts that completed successfully in the latest run after failing in the previous run. |
Never responded | Hosts that did not respond in any of the compared runs. These entries might represent unused IP addresses, inactive devices, unreachable subnets, or targets that do not expose a supported discovery protocol. |
Select a summary intelligence to display the hosts in the corresponding category. The selected intelligence highlights the category, and the table shows up to 200 matching hosts.
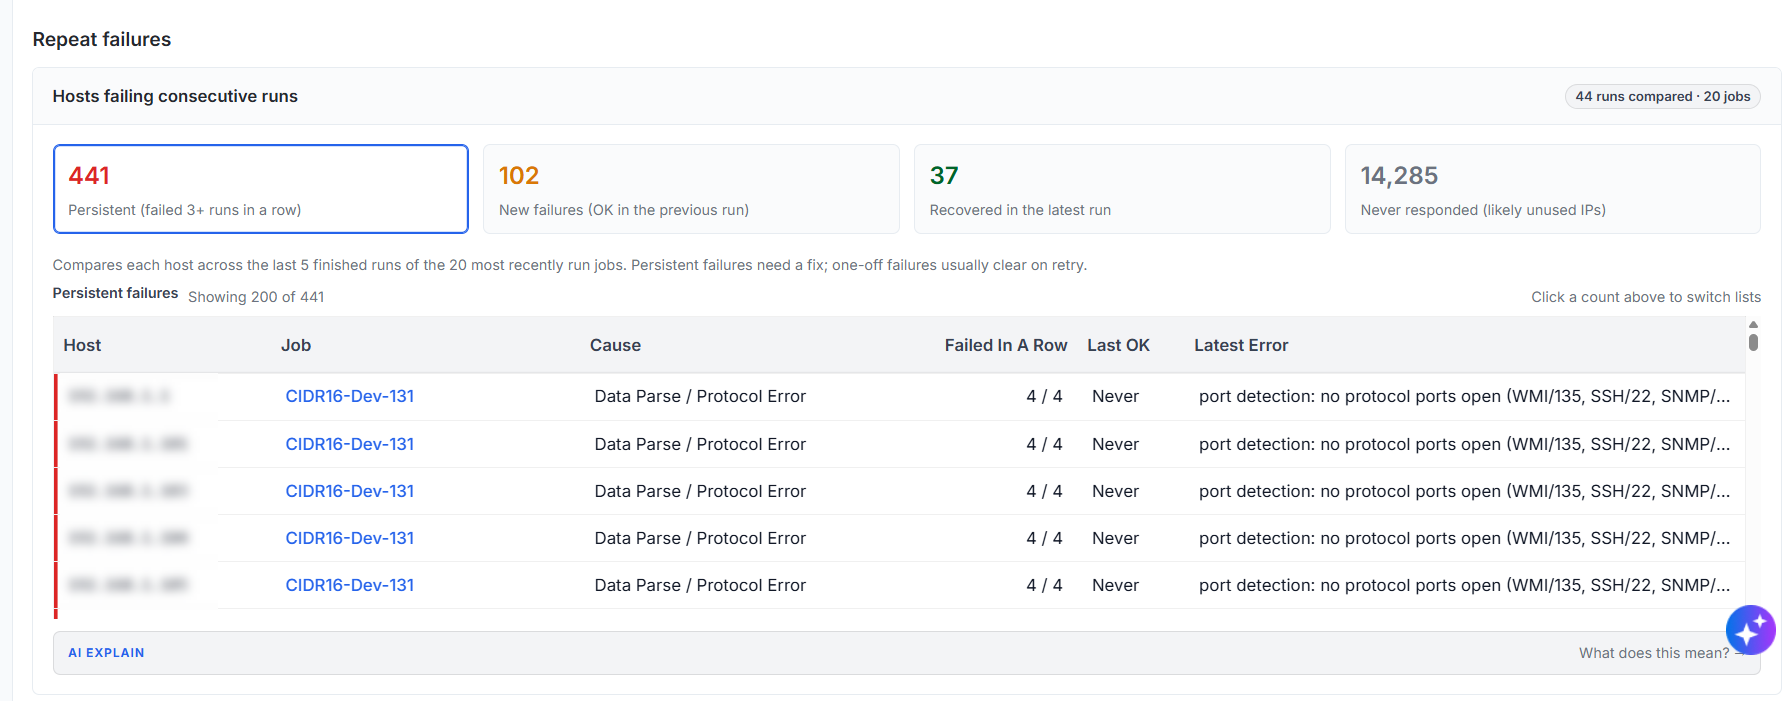
Figure: Repeat Failures
5.3.1 Host failure details
The table provides the following information for each host:
Column | Description |
|---|---|
Host | The IP address or identifier of the affected host. |
Job | The discovery job that attempted to scan the host. Select the job name to open the associated job details. |
Cause | The failure category assigned from the recorded discovery error, such as Data Parse / Protocol Error. |
Failed In A Row | The number of consecutive failures compared with the number of available runs for the host. For example, 4 / 4 means that the host failed in all four compared runs. |
Last OK | The most recent run in which discovery completed successfully for the host. Never indicates that the host did not complete successfully in any of the compared runs. |
Latest Error | The most recent error recorded for the host. Use this information to identify the protocol, port, connectivity, credential, or processing issue that requires investigation. |
5.3.2 AI explanation
Select What does this mean? in the AI Explain section to generate an explanation of the repeat-failure pattern. The generated explanation summarizes the significant findings, identifies common failure patterns, displays a confidence level, and recommends corrective actions based on the available run and host data.
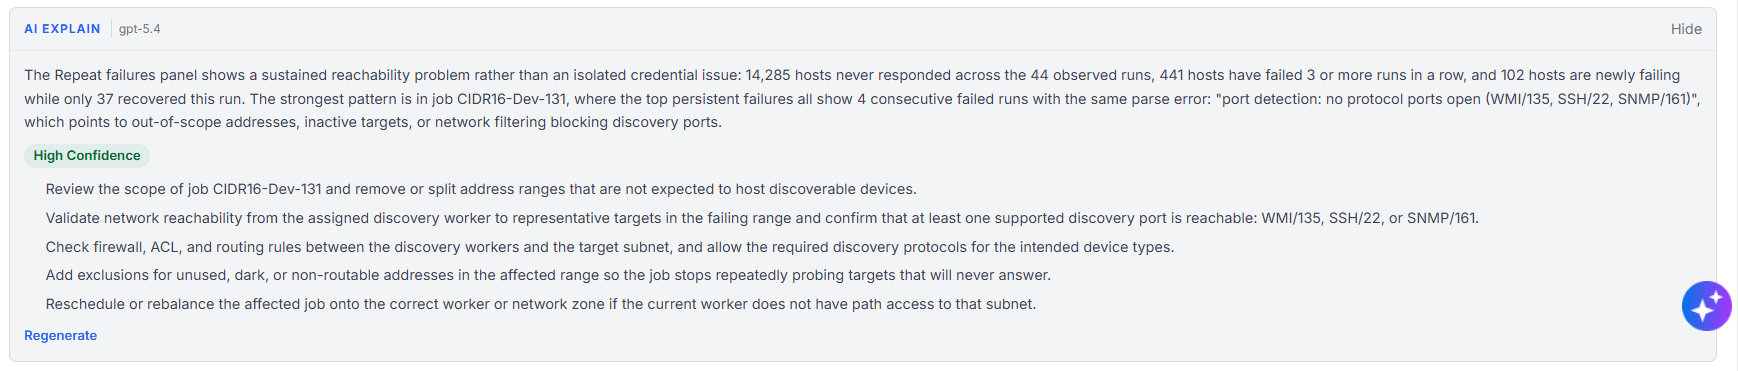
Figure: AI Explanation
After the system generates the explanation, select Hide to collapse it or Regenerate to generate an updated explanation from the available data.
AI-generated recommendations might include reviewing the job scope, testing connectivity from the assigned discovery worker, checking firewall and routing rules, excluding unused IP addresses, or assigning the job to a worker that can access the target network. Review the recommendations before changing the discovery configuration.
Example
In the example shown, the system compared 44 completed runs across 20 discovery jobs. The comparison identified 441 persistent failures, 102 new failures, 37 recovered hosts, and 14,285 hosts that never responded.
Select the Persistent failures category to display 200 of the 441 matching hosts in the table. The CIDR16-Dev-131 job includes the visible hosts, which failed all four available runs, as indicated by 4 / 4 in the Failed In A Row column. The Last OK value is Never, which means that the hosts did not complete discovery successfully in any of the compared runs.
The latest error reports that no supported protocol ports were open. This can mean that the addresses are outside the intended discovery scope, the devices are inactive, a firewall blocks access, or the discovery worker cannot reach the required ports.
After you select What does this mean?, AI Explain identifies a recurring connectivity pattern and generates recommendations. In this example, the guidance recommends reviewing the scope of CIDR16-Dev-131, verifying access from the discovery worker to supported ports such as WMI 135, SSH 22, and SNMP 161, checking firewall and routing rules, excluding unused or non-routable addresses, and confirming that the job uses a worker with access to the target subnet.
6. Jobs needing attention
The Jobs needing attention section lists discovery jobs with device failures in their recent runs. Use this section to identify jobs with a high failure rate, review whether failures are recurring, inspect affected devices and logs, and rerun a job after correcting the underlying issue.
The number in the upper-right corner of the Recently Failed Jobs intelligence shows how many jobs currently meet the failure criteria. Each job row summarizes its latest run and displays the job name, when the run started, run duration, most frequent error, number of devices associated with that error, current run status, and failed-device count.
A job can appear in this section even when its run status reads Completed. The job workflow can finish while one or more devices in the run still fail. A Partial status indicates that the run finished with incomplete results, while Running indicates that the current run is still in progress and the displayed counts can change.
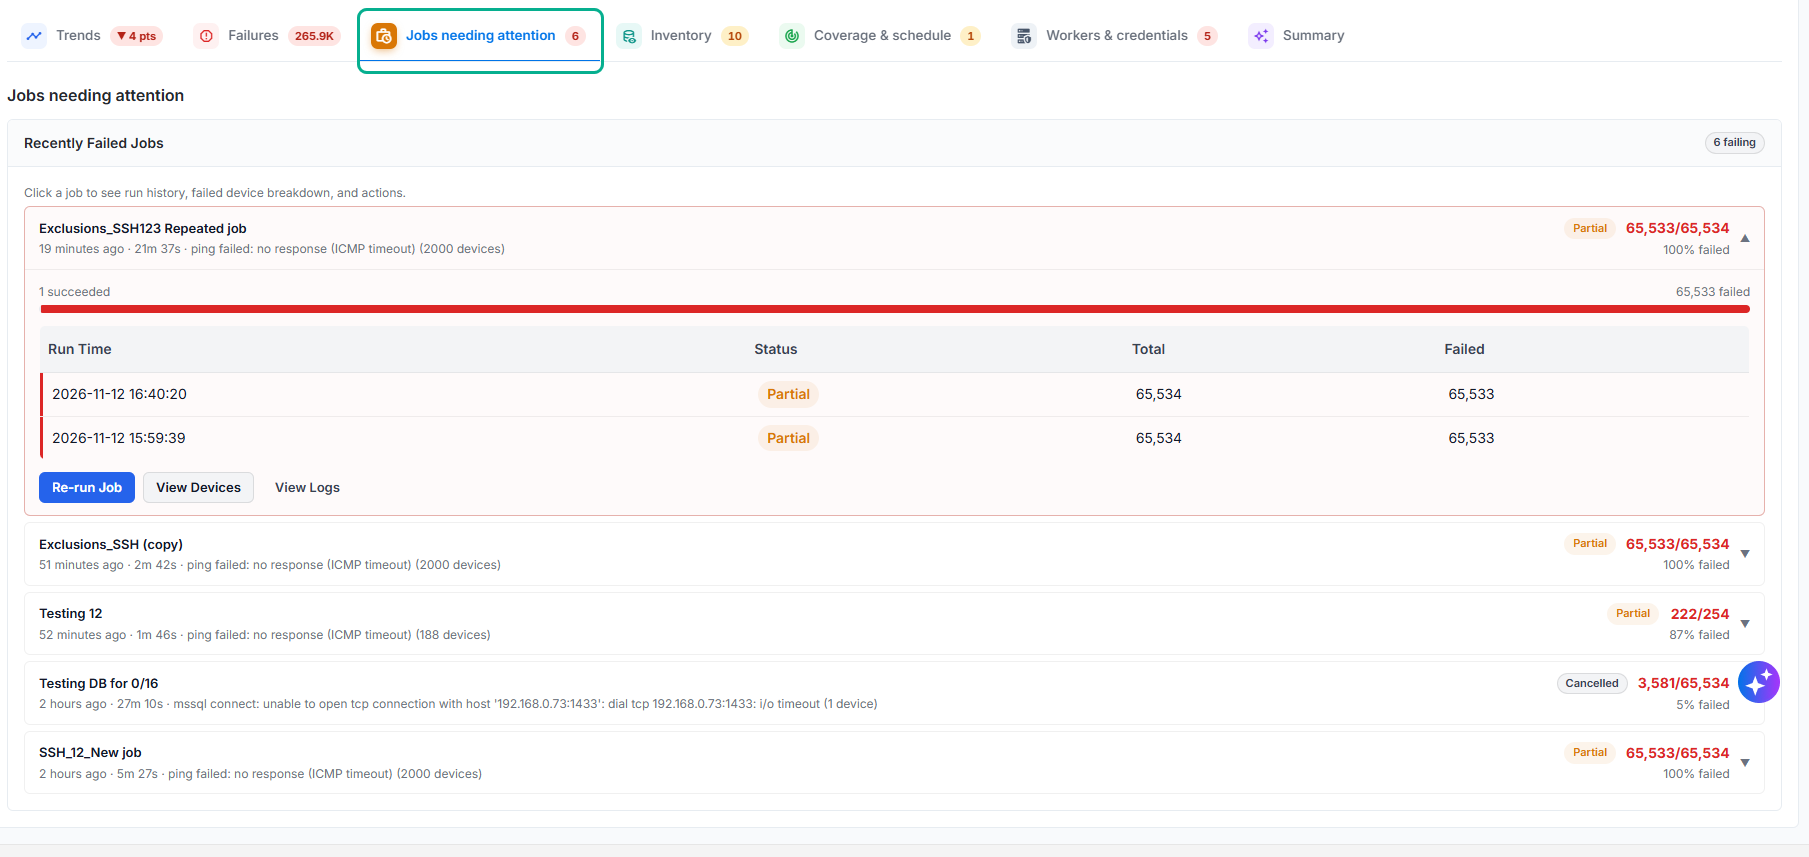
Figure: Jobs needing attention
6.1 Job summary
Each collapsed job row provides the following information:
Field | Description |
|---|---|
Job name | Identifies the discovery job. Select the row to expand its recent run details and available actions. |
Last run | Shows how long ago the latest run started. |
Duration | Shows how long the latest run took. A duration might not be available while a job is still running. |
Frequent error | Shows the most common error reported by affected devices in the latest run. The value in parentheses is the number of devices associated with that error. |
Status | Shows the current or final state of the latest run, such as Running, Partial, or Completed. |
Failed / total | Shows the number of failed devices compared with the total number of devices processed in the run. |
Failure percentage | Shows the percentage of processed devices that failed in the latest run. |
Select a job row to view the run history and actions. The expanded view shows the successful and failed device counts, a visual distribution bar, and recent runs for the selected job.
6.2 Run history
The run-history table helps determine whether failures occur in one run or repeat across runs.
Column | Description |
|---|---|
Run Time | The date and time when the discovery run started. |
Status | The final or current status of the run. |
Total | The total number of devices processed during the run. |
Failed | The number of devices that failed during the run. |
When the same number of devices fails across many runs, review the affected devices and error details for a persistent connectivity, credential, protocol, scope, or target-side issue.
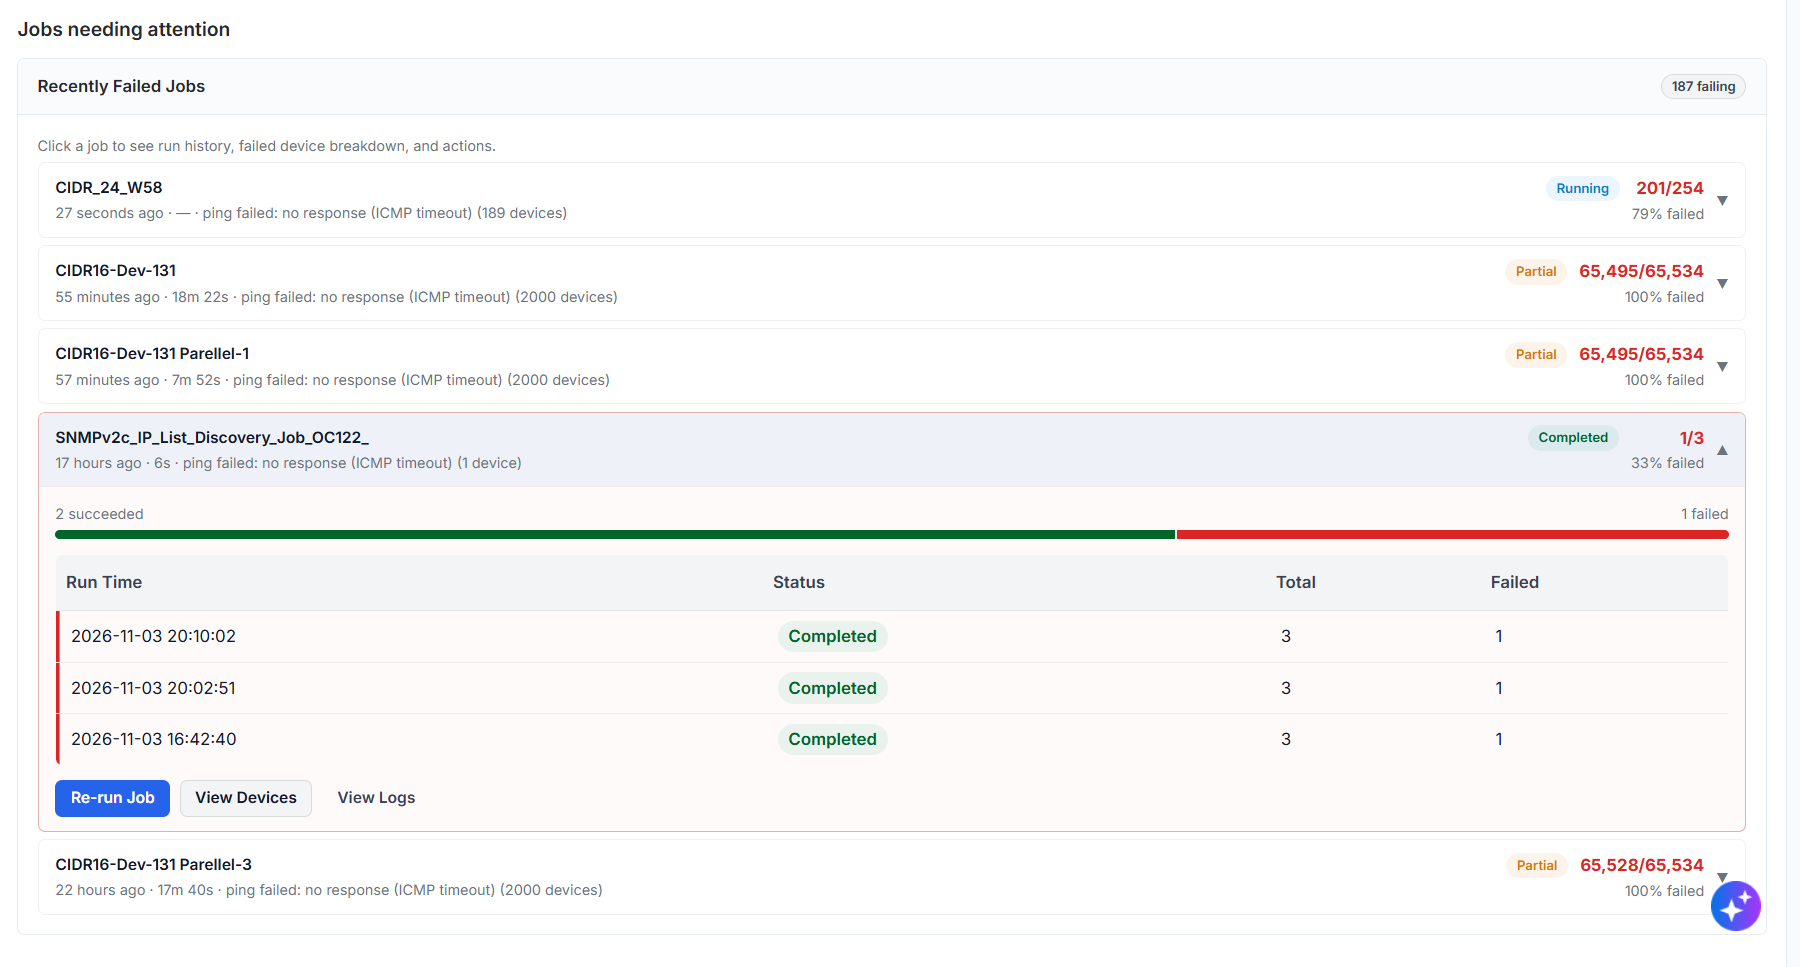
Figure: Jobs needing attention
6.3 Available actions
Action | Description |
|---|---|
Re-run Job | Starts a new run of the selected discovery job. Use this action after correcting the job configuration, worker assignment, credentials, connectivity, or target-side issue. The application displays the new run status after the job starts. |
View Devices | Opens the affected-device list for the selected job so you can review device details and recorded failures. |
View Logs | Opens the logs for the selected job. Use the logs to review connection attempts, protocol responses, errors, and other execution details. |
6.4 Example
In the example shown, 187 jobs have recent device failures. The listed jobs include runs with Running, Partial, and Completed statuses.
The example expands the SNMPv2c_IP_List_Discovery_Job_OC122_ job. The latest run completed in 6 seconds and processed 3 devices. Of these devices, 2 succeeded and 1 failed, resulting in a 33% failure rate. The most frequent error is ping failed: no response (ICMP timeout) and affects one device.
The run history shows three completed runs:
Run Time | Status | Total | Failed |
|---|---|---|---|
2026-11-03 20:10:02 | Completed | 3 | 1 |
2026-11-03 20:02:51 | Completed | 3 | 1 |
2026-11-03 16:42:40 | Completed | 3 | 1 |
The same failure count appears in all three runs, which indicates that the issue is recurring rather than limited to one run. Select View Devices to identify the device that did not respond, and select View Logs to review the ICMP timeout details. Verify that the device is online and reachable from the assigned discovery worker, and review network routing or firewall rules that might block ICMP. After correcting the issue, select Re-run Job and review the new run status.
The CIDR16-Dev-131 and CIDR16-Dev-131 Parallel-1 jobs show 65,495 failed devices out of 65,534, with a displayed failure rate of 100% after rounding. Both runs report ping failed: no response (ICMP timeout) as the most frequent error, affecting 2,000 devices. Because failures affect nearly the entire target scope, review the CIDR range, discovery-worker network access, routing, and firewall rules before rerunning these jobs.
The CIDR_24_W58 job is still running and currently shows 201 failed devices out of 254, or 79% failed. Because the run is in progress, the totals and failure percentage can change until the job completes.
7. Inventory
The Inventory tab shows when discovery last scanned each device and where device data comes from. Review device updates, discovery protocols, and operating systems to understand inventory changes and composition.
7.1 Inventory freshness and sources
The Inventory freshness and sources section provides an overview of how current the discovered inventory is, where the device information originated, and how frequently discovery updates device records. Use this section to identify devices with outdated discovery information, review inventory distribution across discovery sources, locate jobs associated with stale devices, and monitor devices whose discovered fields changed during recent re-scans.
The system determines inventory freshness from the most recent successful scan recorded for each device. A device can remain in the discovered inventory even when recent scan attempts fail. This means freshness information helps administrators determine whether the stored device data still reflects the current environment.
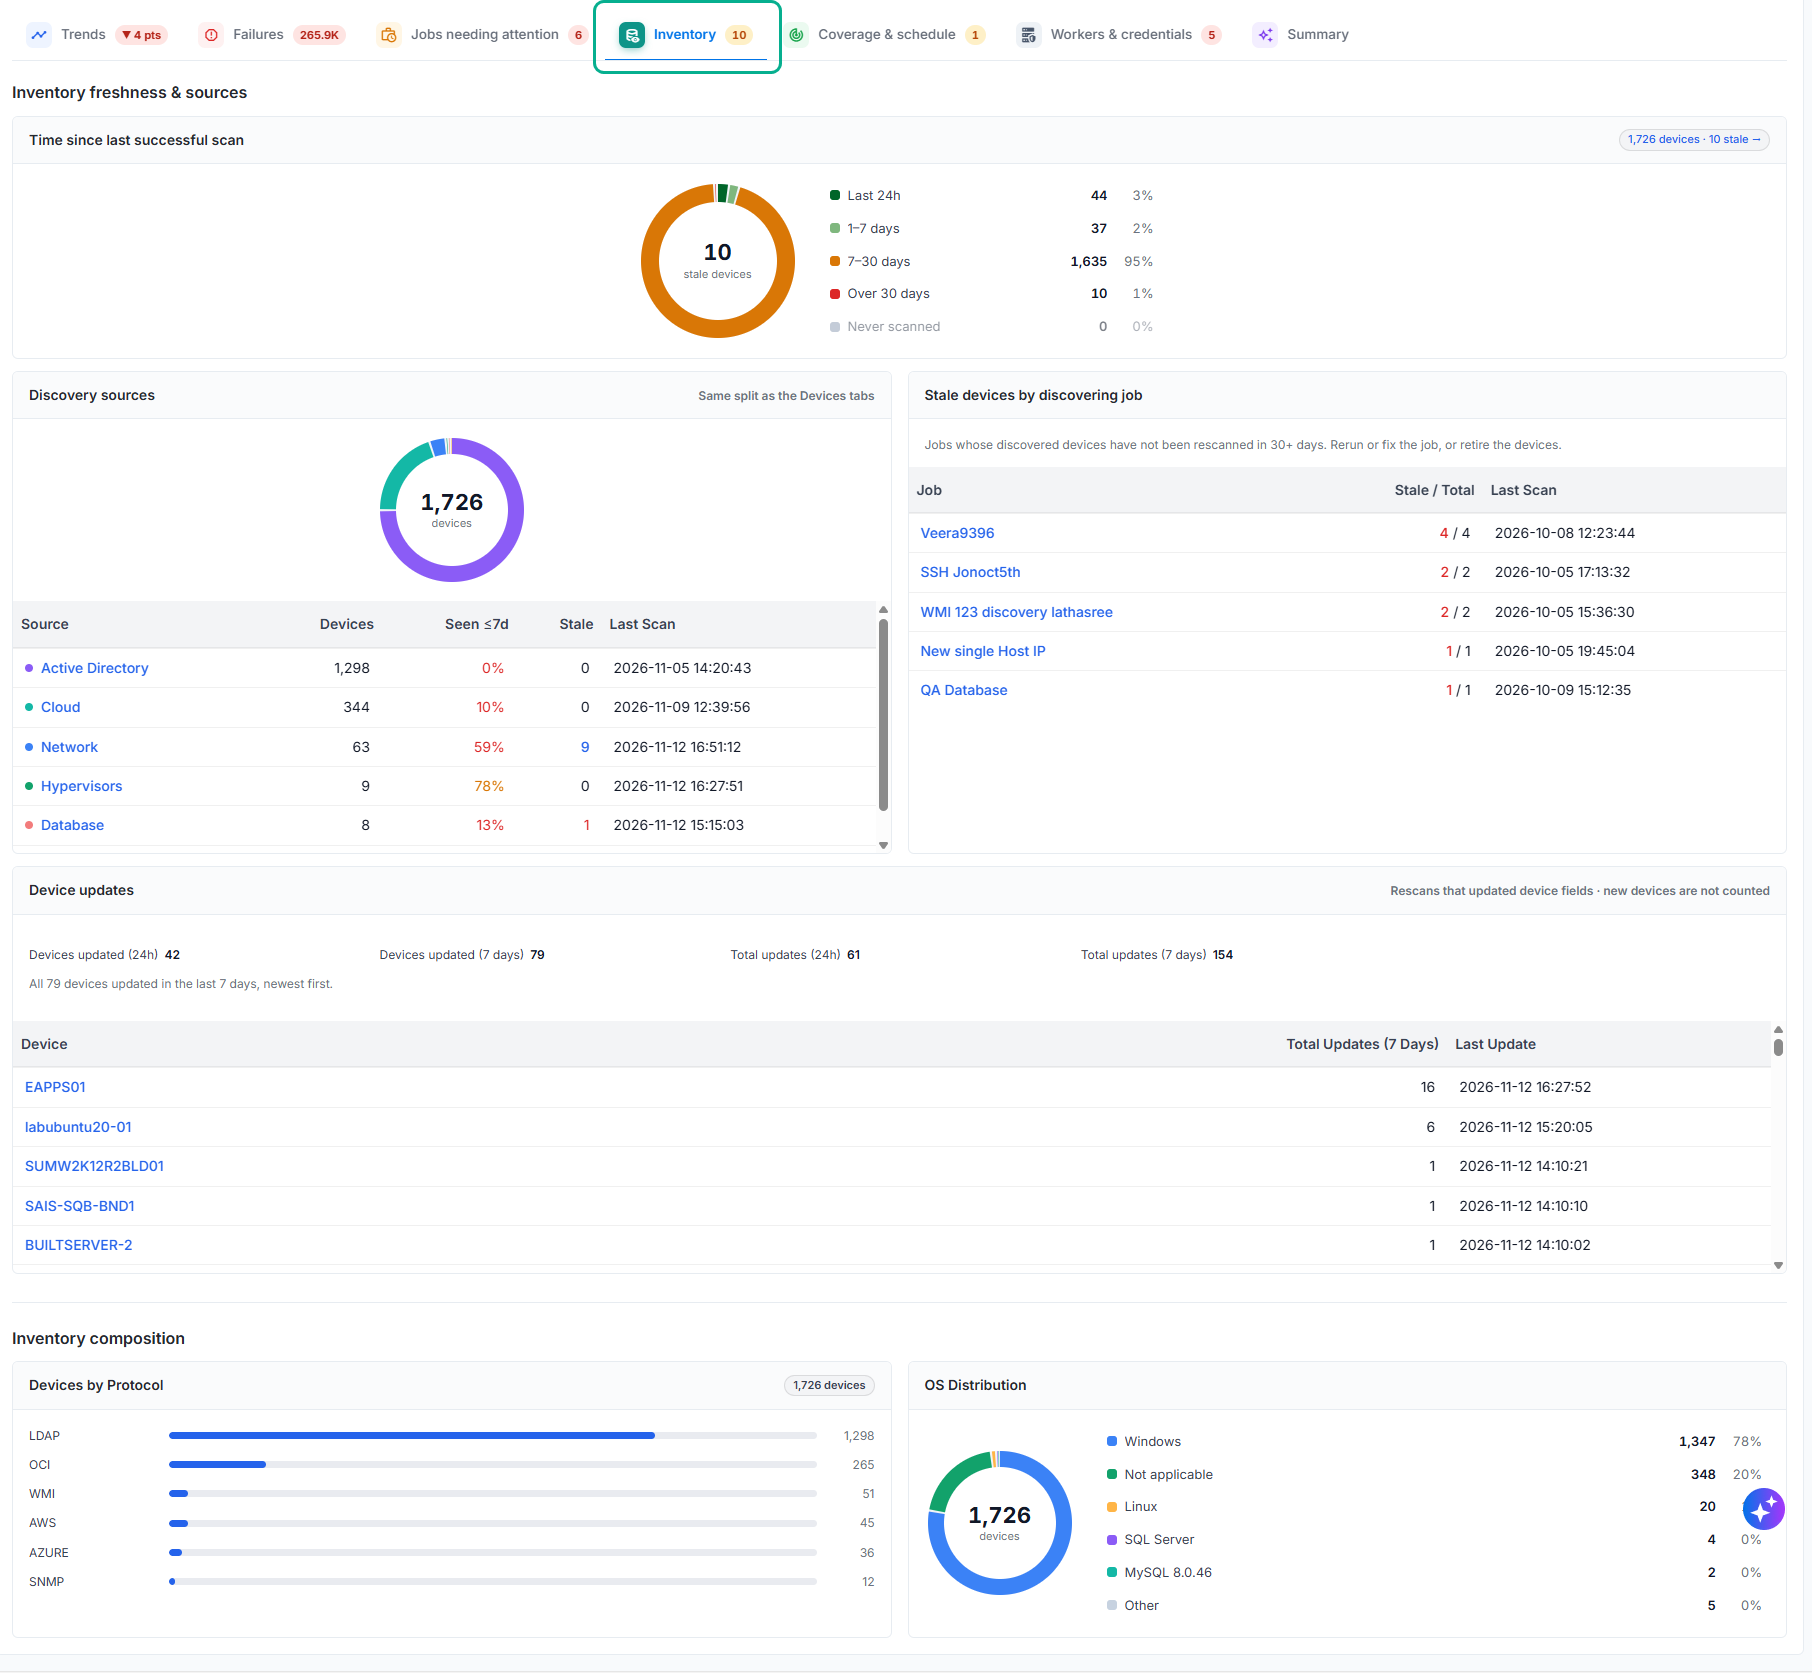
Figure: Inventory
The section includes the following cards:
Card | Description |
|---|---|
Time since last successful scan | Groups devices by the time elapsed since their most recent successful scan and identifies stale or never-scanned devices. |
Discovery sources | Shows how devices span discovery sources and provides freshness information for each source. |
Stale devices by discovering job | Identifies discovery jobs associated with devices that have not completed a successful scan in more than 30 days. |
Device updates | Shows devices whose discovered fields changed during recent scans. New devices are not included in these update counts. |
7.1.1 Time since last successful scan
The Time since last successful scan intelligence shows how recently the devices in the discovered inventory completed a successful scan. Use this intelligence to assess the overall freshness of the inventory and identify devices whose stored information might no longer reflect their current state.
The total in the center of the chart represents all devices included in the freshness analysis. The indicator in the upper-right corner shows the total number of devices and the number classified as stale. The system classifies a device as stale when its last successful scan occurred more than 30 days ago. The system reports separately any devices that have never completed a successful scan.
The chart groups devices according to the time elapsed since their last successful scan:
Scan age | Description |
|---|---|
Last 24h | Devices that completed a successful scan within the last 24 hours. These devices contain the most recent discovery information. |
1–7 days | Devices whose latest successful scan occurred more than 24 hours ago but within the last seven days. |
7–30 days | Devices whose latest successful scan occurred more than seven days ago but within the last 30 days. These devices are not stale, but might require attention when administrators expect scans to run more frequently. |
Over 30 days | Devices that have not completed a successful scan in more than 30 days. The intelligence classifies these devices as stale because the stored inventory information might no longer reflect their current state. |
Never scanned | Devices for which the system does not have a successful scan record. Administrators might have added these devices to the inventory without completing discovery successfully. |
Each category displays the number of devices and its percentage of the total inventory. The size of each chart segment represents the proportion of devices in that category. A larger Over 30 days or Never scanned segment indicates that more devices require investigation.
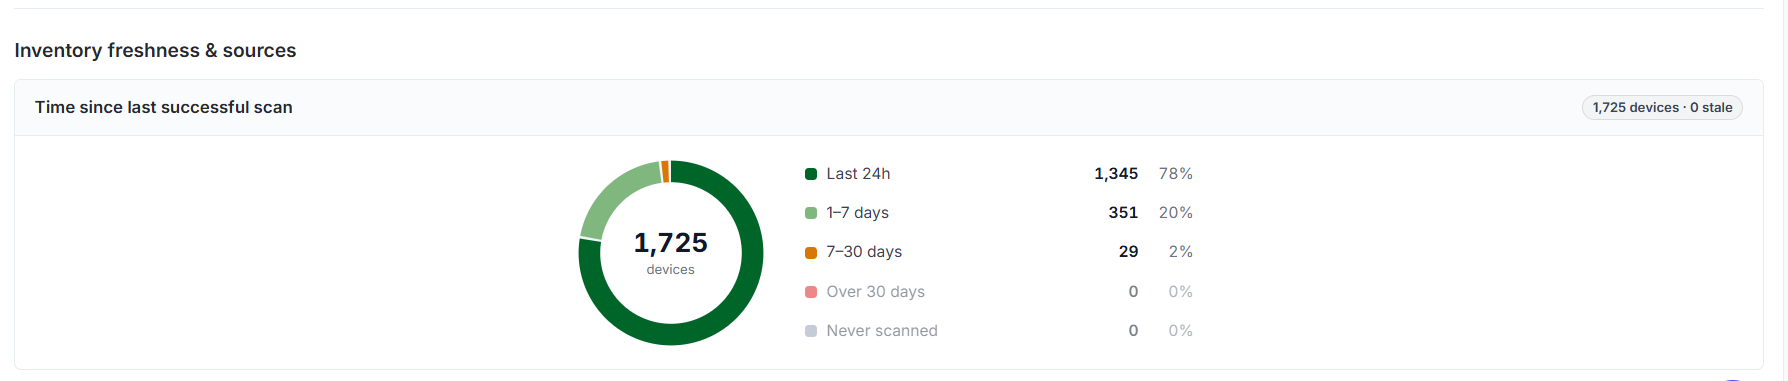
Figure: Time since last successful
Example
In the example shown, the freshness analysis covers 1,725 devices, and 0 devices are stale.
Scan age | Devices | Percentage |
|---|---|---|
Last 24h | 1,345 | 78% |
1–7 days | 351 | 20% |
7–30 days | 29 | 2% |
Over 30 days | 0 | 0% |
Never scanned | 0 | 0% |
Total | 1,725 | 100% |
The values show that 1,696 devices, or 98% of the inventory, completed a successful scan within the last seven days. The remaining 29 devices completed a successful scan within the last 7 to 30 days. Because no device is in the Over 30 days category, the intelligence reports 0 stale devices.
If a device moves into the Over 30 days category, review the associated discovery job, schedule, connectivity, credentials, and discovery worker availability to determine why the device is no longer completing successful scans.
7.1.2 Discovery sources
The Discovery sources intelligence shows how devices in the discovered inventory span source types, such as Cloud, Network, Hypervisors, Database, and Container. Use this intelligence to compare inventory volume and scan freshness across discovery sources and identify sources that might require attention.
The total in the center of the chart represents all devices in the discovered inventory. Each colored segment represents a discovery source, and the segment size indicates that source’s share of the total inventory. The source distribution matches the categories available on the Devices tabs.
The table provides inventory and freshness details for each source:
Column | Description |
|---|---|
Source | The discovery source associated with the devices. Select a source to open the corresponding device list. |
Devices | The total number of devices associated with the source. |
Seen <=7d | The percentage of devices for which discovery jobs completed a successful scan within the last seven days. A lower percentage indicates that discovery jobs have not successfully scanned a larger proportion of devices within the last seven days. |
Stale | The number of devices whose last successful scan occurred more than 30 days ago. A value of 0 means that the source contains no stale devices. |
Last Scan | The date and time of the most recent successful scan recorded for the source. This value indicates recent scan activity for the source, but does not mean that the source’s most recent scan included every device. |
The Seen <=7d value and the Stale count measure different freshness periods. A source can have a low Seen <=7d percentage and still show 0 stale devices. In this case, some devices were last scanned more than seven days ago but within the 30-day stale threshold.
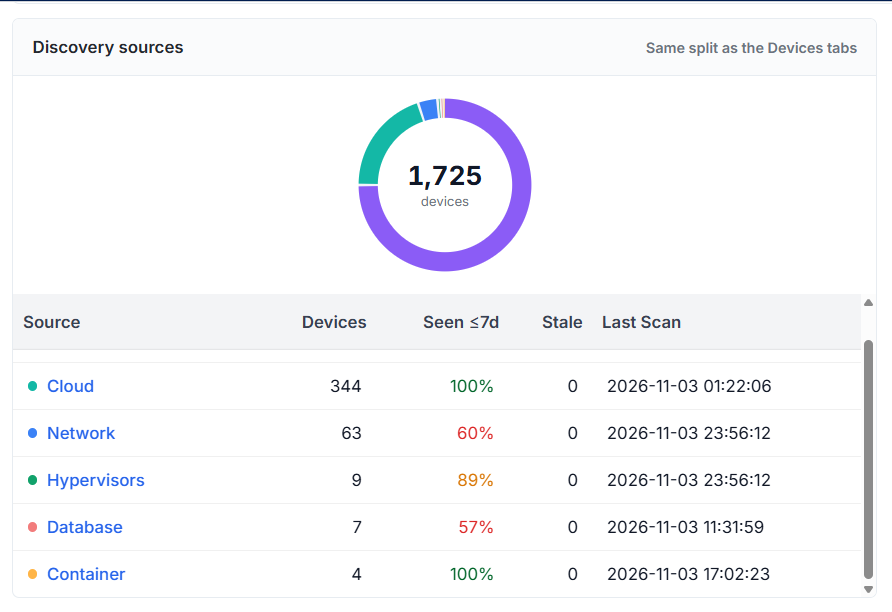
Figure: Discovery Sources
Example
In the example shown, the discovered inventory contains 1,725 devices. The visible source rows show the following information:
Source | Devices | Seen <=7d | Stale | Last Scan |
|---|---|---|---|---|
Cloud | 344 | 100% | 0 | 2026-11-03 01:22:06 |
Network | 63 | 60% | 0 | 2026-11-03 23:56:12 |
Hypervisors | 9 | 89% | 0 | 2026-11-03 23:56:12 |
Database | 7 | 57% | 0 | 2026-11-03 11:31:59 |
Container | 4 | 100% | 0 | 2026-11-03 17:02:23 |
All 344 Cloud devices and all 4 Container devices completed a successful scan within the last seven days. For Network, discovery jobs successfully scanned 60% of the 63 devices within seven days; the remaining devices had their last successful scan more than seven days ago. The Stale count is 0, which means that none of the Network devices exceeded the 30-day stale threshold.
Database has the lowest visible freshness percentage at 57%. This means that 57% of the seven Database devices completed a successful scan within the last seven days. Because the source shows 0 stale devices, the remaining Database devices completed a successful scan within the last 30 days.
Use the table to focus on sources with a low Seen <=7d percentage or a nonzero Stale count. Review the associated discovery jobs, schedules, credentials, connectivity, and discovery worker availability when a source does not meet the expected scan frequency.
7.1.3 Stale devices by discovering job
The Stale devices by discovering job intelligence lists jobs with discovered devices that the job has not scanned in more than 30 days. Use the list to rerun or correct the job, or retire devices that are no longer required.
When no stale devices exist, the intelligence confirms that every discovered device was re-scanned within the last 30 days.
7.1.4 Device updates
The Device updates section shows devices whose existing inventory information changed during successful re-scans. Use this section to understand how frequently discovery refreshes device records and identify devices with many field updates during the last seven days.
Discovery counts only re-scans that update one or more fields in an existing device record. It does not count newly discovered devices as device updates. A single device can have more than one field updated during a re-scan, and discovery can update that device across many re-scans. The total number of updates can be higher than the number of devices updated.
The summary displays the following metrics:
Metric | Description |
|---|---|
Devices updated (24h) | The number of existing devices for which discovery updated at least one discovered field during the last 24 hours. Each device counts once, regardless of the number of fields discovery updated. |
Devices updated (7 days) | The number of existing devices for which discovery updated at least one discovered field during the last seven days. Each device counts once for the period. |
Total updates (24h) | The total number of field updates across all existing devices during the last 24 hours. Discovery counts many field updates on the same device separately. |
Total updates (7 days) | The total number of field updates across all existing devices during the last seven days. Many updates to the same device contribute to this total. |
The device table shows up to 100 of the most recently updated devices from the last seven days, with the newest updates displayed first.
Column | Description |
|---|---|
Device | The name or identifier of the updated device. Select the device name to open its details. |
Total Updates (7 Days) | The total number of discovered field updates recorded for the device during the last seven days. |
Last Update | The date and time when discovery most recently updated the device record. |
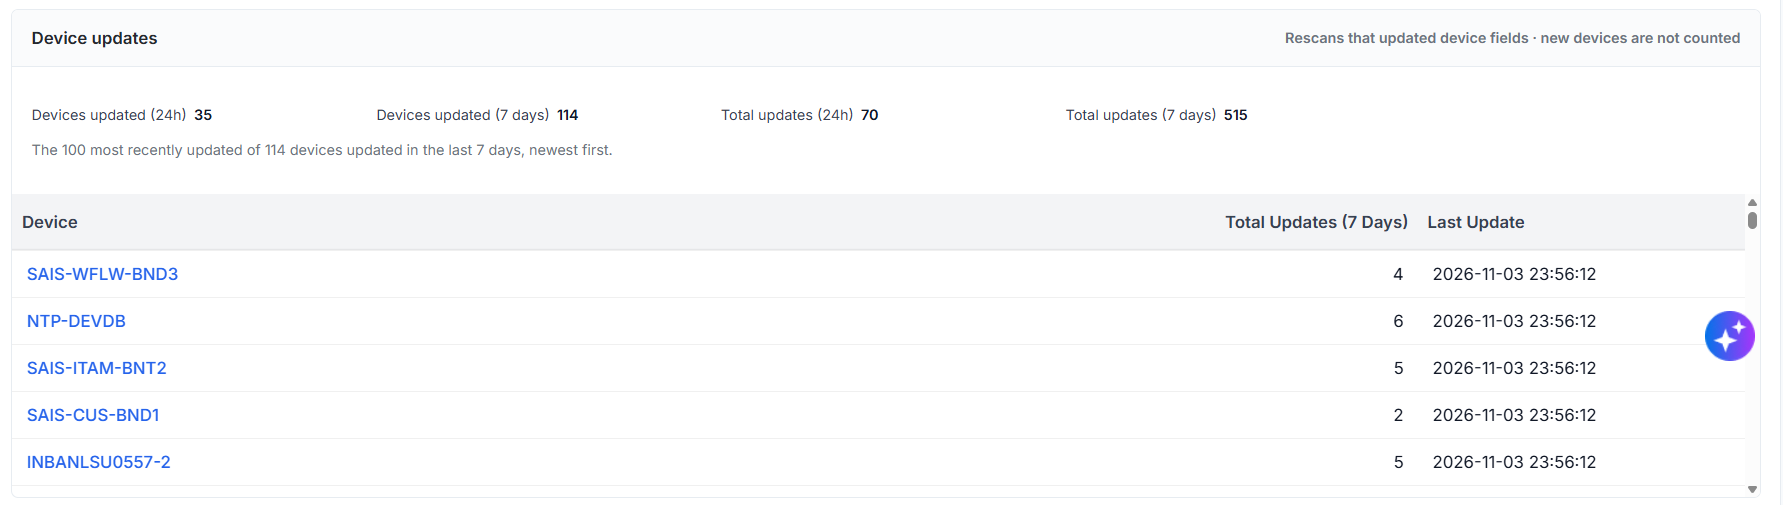
Figure: Discovery Updates
Example
In the example shown, discovery updated 35 devices during the last 24 hours and 114 devices during the last seven days. Discovery recorded 70 total field updates during the last 24 hours and 515 total field updates during the last seven days.
The difference between the device and update counts indicates that some devices had more than one field updated. For example, 35 devices produced 70 updates during the last 24 hours, which is an average of two updated fields per device. The exact number of updates can vary by device.
The table displays the 100 most recently updated devices out of the 114 devices updated during the last seven days. For example, NTP-DEVDB has 6 total updates, while SAIS-WFLW-BND3 has 4 total updates. Both device records were last updated on 2026-11-03 at 23:56:12.
Use the table to identify devices with frequent changes and open a device record when the updated inventory information requires further review.
7.2 Inventory composition
The Inventory composition section shows how discovery protocols and operating systems group devices in the discovered inventory. Use this section to understand which protocols contribute most of the inventory and review the operating-system mix across discovered devices.
The section includes:
Devices by Protocol
OS Distribution
7.2.1 Devices by Protocol
The Devices by Protocol intelligence groups discovered devices by the protocol or integration that collected the device information. The total in the upper-right corner represents the number of devices in the discovered inventory.
Each row shows a protocol and its device count. The horizontal bar represents the protocol’s relative share of the total inventory. A longer bar indicates that the protocol discovered more devices.
Protocol | Description |
|---|---|
LDAP | Devices discovered from a configured LDAP or directory source. |
OCI | Devices discovered from Oracle Cloud Infrastructure. |
WMI | Windows devices discovered by using Windows Management Instrumentation. |
AWS | Devices discovered from Amazon Web Services. |
AZURE | Devices discovered from Microsoft Azure. |
SNMP | Network devices discovered by using Simple Network Management Protocol. |
The protocol counts classify devices by their recorded discovery protocol. Use the distribution to identify the protocols responsible for most of the inventory and to determine whether the observed device mix matches the configured discovery sources.
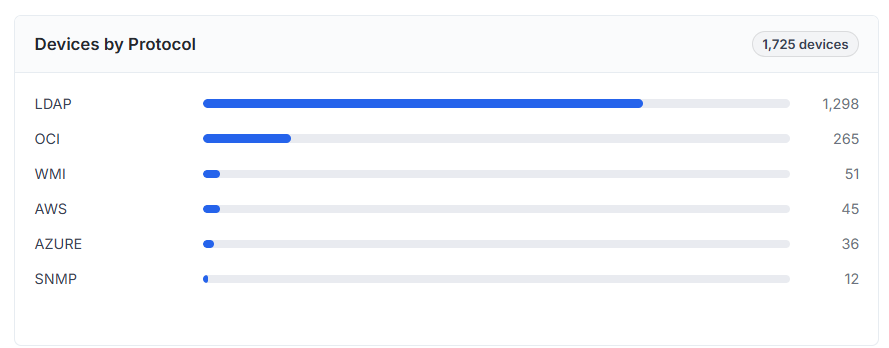
Figure: Devices by Protocol
Devices by Protocol example
In the example shown, the discovered inventory contains 1,725 devices.
Protocol | Devices | Approximate share |
|---|---|---|
LDAP | 1,298 | 75% |
OCI | 265 | 15% |
WMI | 51 | 3% |
AWS | 45 | 3% |
AZURE | 36 | 2% |
SNMP | 12 | 1% |
LDAP contributes the largest number of devices, with 1,298 of the 1,725 devices. OCI is the second-largest source with 265 devices. WMI, AWS, AZURE, and SNMP account for smaller portions of the inventory.
The visible protocol counts total 1,707, which is lower than the overall inventory total of 1,725. This indicates that the displayed list omits the protocols for 18 devices or that the listed protocol categories do not represent those devices.
7.2.2 OS Distribution
The OS Distribution intelligence groups discovered devices by the operating-system value recorded in the inventory. Use this intelligence to understand the operating-system composition of the environment and identify devices for which an operating system does not apply or that fall under another category.
The total in the center of the chart represents all devices included in the distribution. Each colored segment represents an operating-system category. The list shows the device count and percentage for each category.
Category | Description |
|---|---|
Windows | Devices identified with a Windows operating system. |
Not applicable | Inventory records for which an operating-system value does not apply, such as certain cloud, platform, database, or non-host resources. |
Linux | Devices identified with a Linux operating system. |
SQL Server | Records classified with SQL Server as the reported operating-system or platform value. |
MySQL 8.0.46 | Records classified with MySQL 8.0.46 as the reported operating-system or platform value. |
Other | Devices with operating-system values that are not displayed as separate categories. |
Rounding percentages to whole numbers means categories with a small number of devices can display 0% even though their device count is greater than zero.
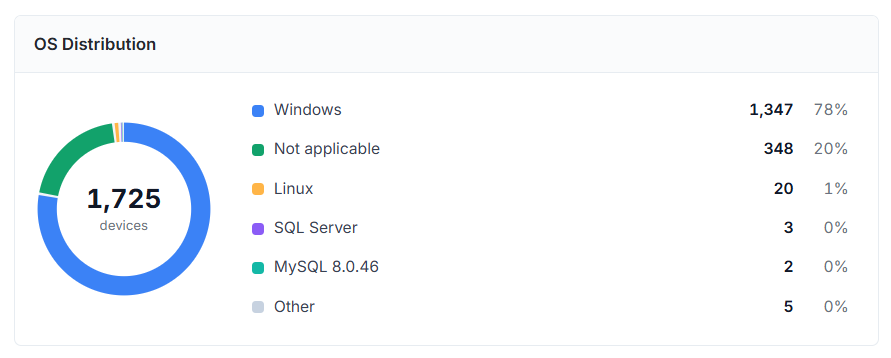
Figure: OS Distribution
OS Distribution example
In the example shown, the operating-system distribution includes 1,725 devices.
OS category | Devices | Percentage |
|---|---|---|
Windows | 1,347 | 78% |
Not applicable | 348 | 20% |
Linux | 20 | 1% |
SQL Server | 3 | 0% |
MySQL 8.0.46 | 2 | 0% |
Other | 5 | 0% |
Total | 1,725 | 99%* |
Windows represents the largest category, with 1,347 devices. The Not applicable category contains 348 records, while Linux and the remaining categories account for few devices.
The displayed percentages total 99% because rounding each category to a whole percentage produces that total. The device counts still total 1,725.
8. Coverage & schedule
The Coverage & schedule section helps administrators verify that discovered on-premises devices remain within an active discovery job scope and that discovery jobs run as expected. Use this section to verify that active discovery jobs include discovered devices and that the jobs run as expected. The section highlights devices and network ranges that are not covered by any active job, as well as jobs with missed, missing, or inactive schedules.
The section includes:
Coverage gaps
Schedule health
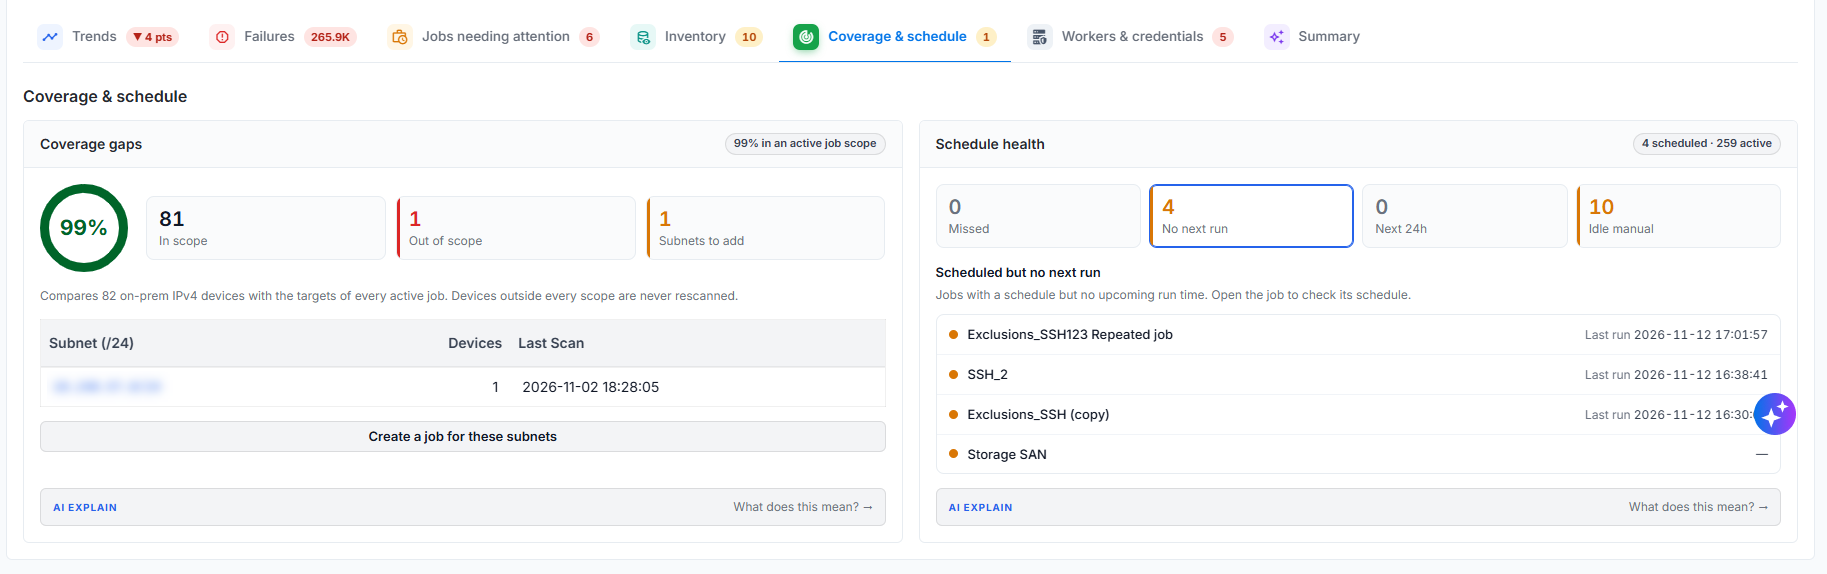
Figure: Coverage & schedule
8.1 Coverage gaps
The Coverage gaps intelligence compares discovered on-premises IPv4 devices with the targets configured in active discovery jobs. Use the intelligence to identify devices and network ranges that are not included in any active job scope.
Devices outside every active job scope are not re-scanned. As a result, the information stored for those devices can become outdated even though the devices remain in the discovered inventory.
The percentage in the chart represents the proportion of evaluated devices included in at least one active job scope. The indicator in the upper-right corner shows the overall coverage result.
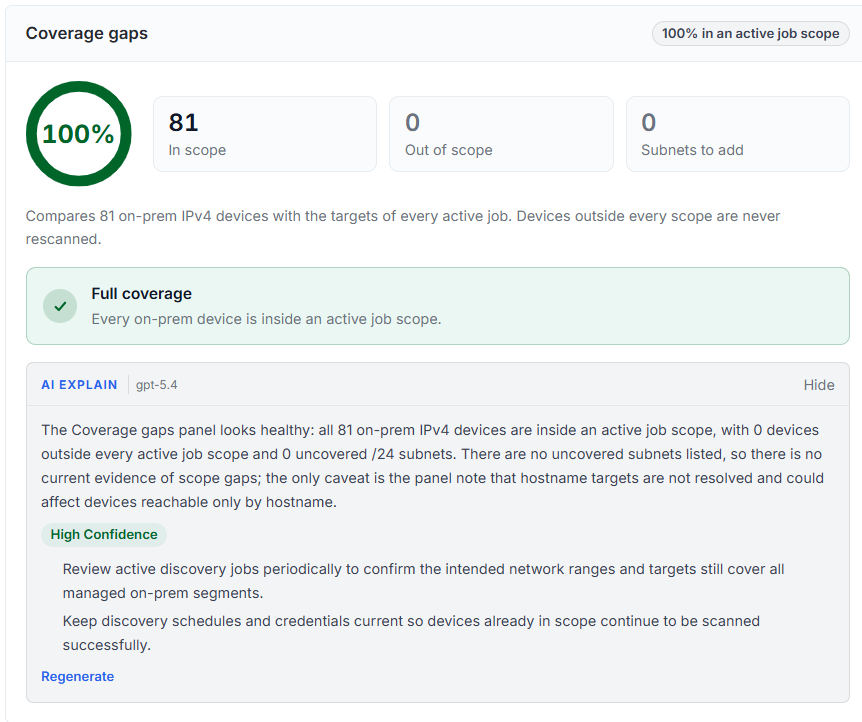
Figure: Coverage Gaps
Metric | Description |
|---|---|
In scope | The number of discovered on-premises IPv4 devices included in the target scope of at least one active discovery job. |
Out of scope | The number of discovered on-premises IPv4 devices that are not included in any active discovery job scope. These devices are not re-scanned unless an administrator adds them to an active job. |
Subnets to add | The number of uncovered IPv4 /24 subnets that contain out-of-scope devices and might require adding to a discovery job. |
When active discovery jobs cover all evaluated devices, the intelligence displays Full coverage. If the intelligence identifies uncovered devices or subnets, review the affected network ranges and update the appropriate discovery job.
The coverage comparison uses the targets available in active discovery jobs. The system might exclude hostname-based targets from the comparison if it cannot resolve them to IP addresses.
AI explanation
Select What does this mean? in the AI Explain section to generate an explanation of the coverage results. The generated explanation summarizes the current coverage, identifies possible gaps or limitations, displays a confidence level, and recommends actions based on the available device and job-scope information.
After AI Explain generates the explanation, select Hide to collapse it or Regenerate to generate an updated explanation.
8.1.1 Coverage gaps example
In the example shown, the system compares 81 on-premises IPv4 devices with the targets configured in all active discovery jobs.
Metric | Value |
|---|---|
Coverage | 100% |
In scope | 81 |
Out of scope | 0 |
Subnets to add | 0 |
Active job scopes cover all 81 devices, so the intelligence displays Full coverage and administrators don’t need to add any subnets.
After you select What does this mean?, AI Explain confirms that active job scopes cover all devices. The generated guidance also recommends periodically reviewing active job targets, schedules, and credentials to ensure that the jobs continue to cover and scan the devices successfully.
8.2 Schedule health
The Schedule health intelligence summarizes scheduling conditions for active discovery jobs. Use the intelligence to identify missed runs, scheduled jobs without a calculated next run, jobs expected to run during the next 24 hours, and manual jobs that have remained inactive.
The indicator in the upper-right corner shows the number of scheduled jobs and the total number of active jobs. A job can be active without having a recurring schedule, such as a job intended to run manually.
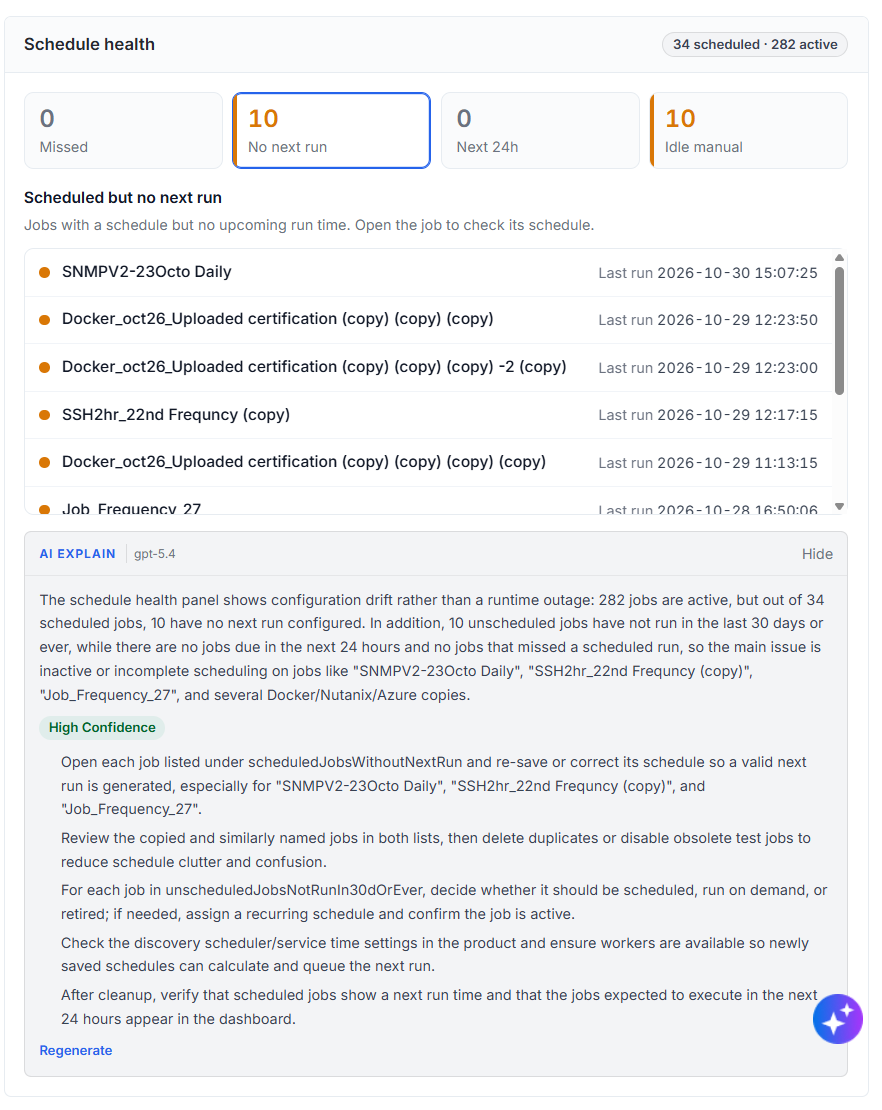
Figure: Schedule Health
The intelligence groups jobs into the following categories:
Category | Description |
|---|---|
Missed | Scheduled jobs that did not start at the expected run time. Review the job schedule, scheduler service, assigned discovery worker, and worker availability. |
No next run | Jobs that have a schedule but do not have an upcoming run time. Open the job and review or save the schedule to generate a valid next run. |
Next 24h | Scheduled jobs with an upcoming run during the next 24 hours. |
Idle manual | Active jobs without a schedule that have not run during the last 30 days or have never run. Review whether to keep each job manual, assign it a schedule, or retire it. |
Select a category to display the matching jobs. The dashboard highlights the selected category, and the list shows the job name and its most recent run time when available. Select a job name to open the job and review its schedule or configuration.
AI explanation
Select What does this mean? in the AI Explain section to generate an explanation of the schedule-health results. The generated explanation identifies the most significant scheduling conditions, displays a confidence level, and recommends corrective actions based on the listed jobs.
After AI Explain generates the explanation, select Hide to collapse it or Regenerate to generate an updated explanation.
Recommendations can include correcting and saving incomplete schedules, reviewing copied or duplicate jobs, assigning schedules to manual jobs, retiring obsolete jobs, checking scheduler settings, and confirming that discovery workers are available to process upcoming runs.
8.2.1 Schedule health example
In the example shown, 282 discovery jobs are active, and 34 of those jobs have schedules.
Category | Jobs |
|---|---|
Missed | 0 |
No next run | 10 |
Next 24h | 0 |
Idle manual | 10 |
The dashboard selects the No next run category. The list shows 10 jobs that have a schedule but no upcoming run time. Each entry includes the job name and its last recorded run time. For example, SNMPV2-23Octo Daily last ran on 2026-10-30 at 15:07:25.
Open each listed job and review its scheduling configuration. Correct the schedule and save it so that the system calculates a valid next run time.
The intelligence also reports 10 Idle manual jobs. These active jobs do not have schedules and have not run during the last 30 days or have never run. Review each job to determine whether to run it on demand, assign a recurring schedule, disable it, or retire it.
After you select What does this mean?, AI Explain identifies incomplete or inactive scheduling as the primary concern. The generated guidance recommends correcting the schedules of jobs without a next run, reviewing copied or duplicate jobs, deciding whether idle manual jobs are still required, and confirming that scheduler and worker services are available.
9. Workers & credentials
The Workers & credentials section helps administrators verify that discovery workers are available to process jobs and that the credentials used by active jobs can authenticate to target devices. Use this section to identify unavailable workers, blocked or orphaned jobs, authentication failures, and inactive or deleted credentials that require attention.
The section includes:
Discovery workers
Credential health
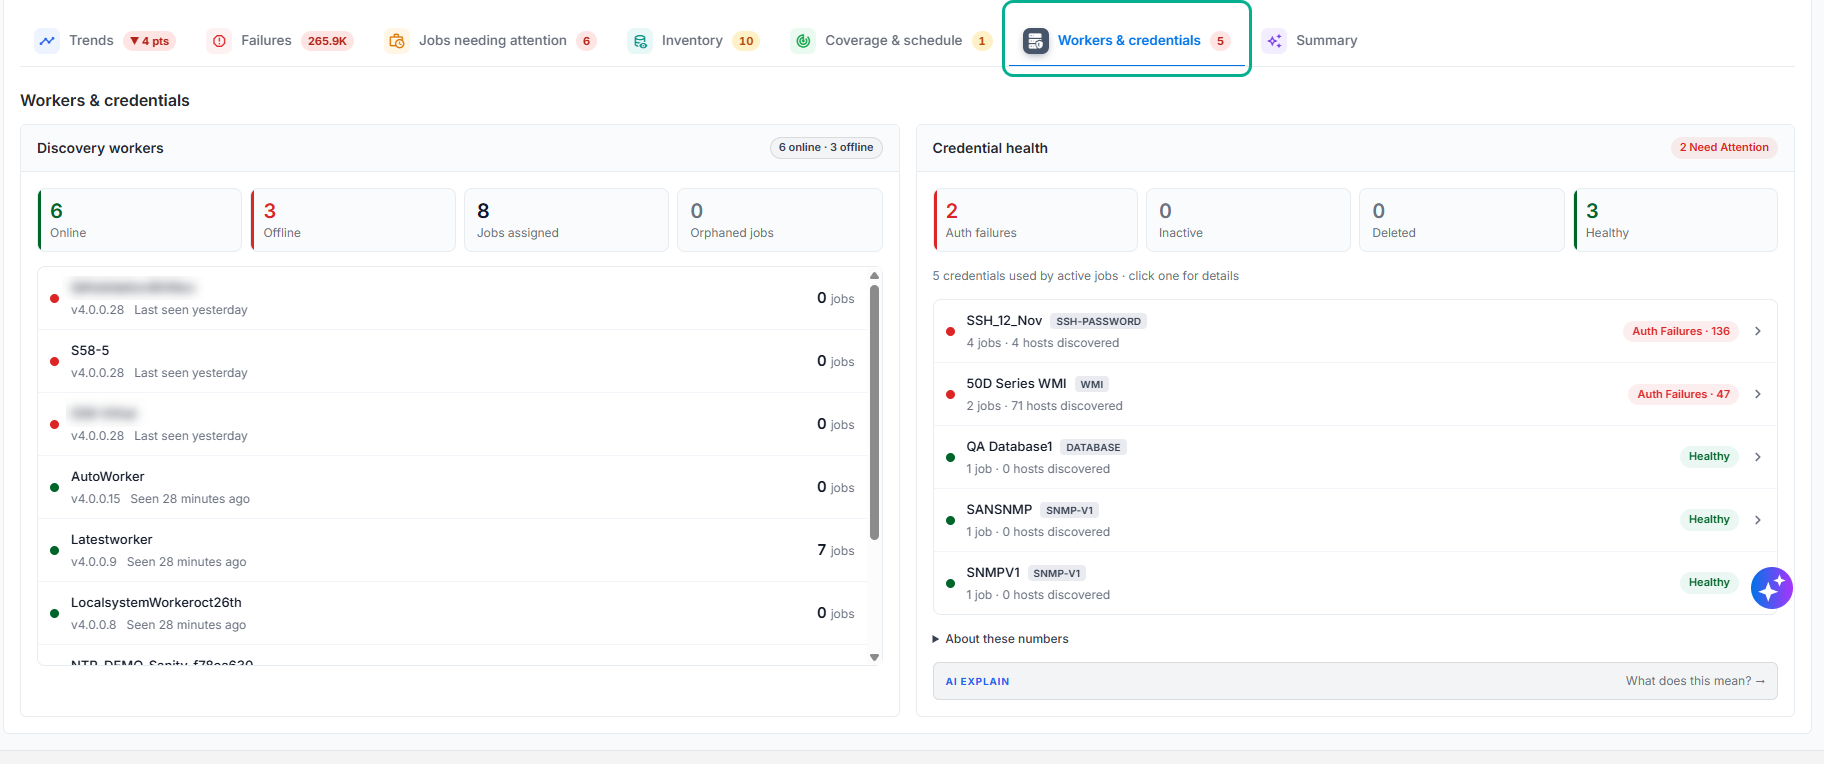
Figure: Workers and Credentials
9.1 Discovery workers
The Discovery workers intelligence shows the connection status of registered discovery workers and the number of discovery jobs assigned to each worker. A worker must be online and available for its assigned jobs to run.
The indicator in the upper-right corner shows the number of online and offline workers. The summary metrics provide the following information:
Metric | Description |
|---|---|
Online | The number of workers connected and available to receive discovery jobs. |
Offline | The number of registered workers that are not currently connected. Jobs assigned to an offline worker remain blocked until the worker reconnects or an administrator assigns the jobs to another worker. |
Jobs assigned | The total number of active discovery jobs assigned to the listed workers. |
Orphaned jobs | The number of active jobs assigned to a worker that an administrator removed. Orphaned jobs cannot run until you select another worker in the job configuration. |
When the intelligence finds orphaned jobs, it displays a warning and lists the affected jobs. Select an affected job to open its configuration and assign an available worker.
The worker list displays the worker name, installed version, last-seen time, number of assigned jobs, and number of blocked jobs. A green status indicator identifies an online worker, while a red status indicator identifies an offline worker. The Last seen value shows how long it has been since the application last received a status update from the worker.
A worker can go offline without orphaning its jobs. Jobs assigned to an offline worker remain associated with that worker and can resume when the worker reconnects. An orphaned job references a worker that no longer exists and requires manual reassignment.
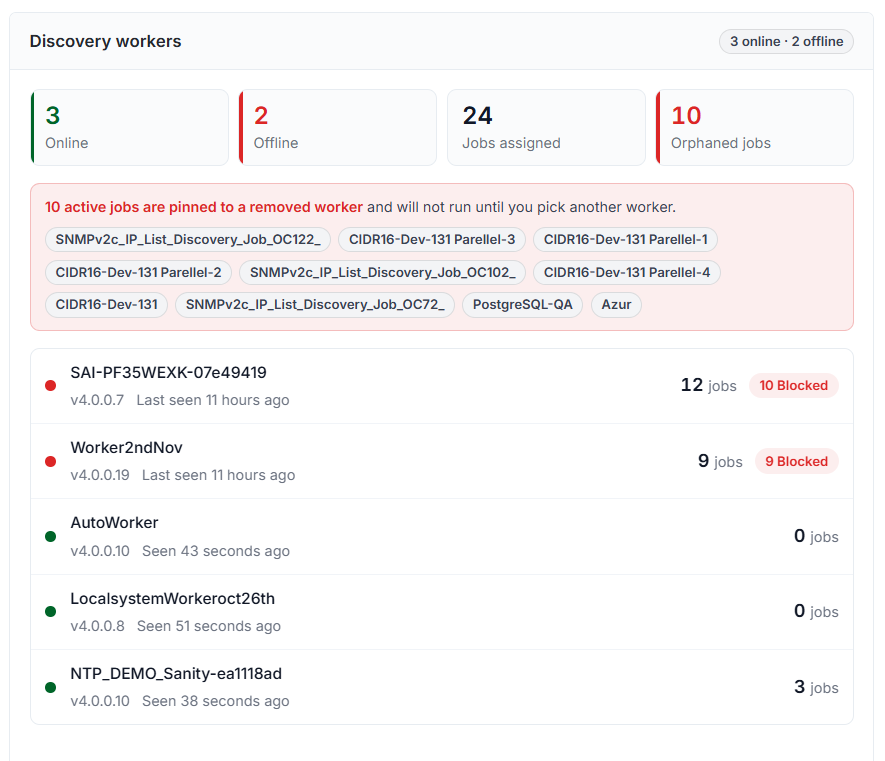
Figure: Discovery Worker
9.1.1 Discovery workers example
In the example, administrators register 5 workers: 3 online and 2 offline. The workers have 24 jobs in total, and removed workers have 10 orphaned jobs.
Worker | Status | Version | Last seen | Assigned jobs | Blocked jobs |
|---|---|---|---|---|---|
SAI-PF35WEXK-07e49419 | Offline | v4.0.0.7 | 11 hours ago | 12 | 10 |
Worker2ndNov | Offline | v4.0.0.19 | 11 hours ago | 9 | 9 |
AutoWorker | Online | v4.0.0.10 | 43 seconds ago | 0 | 0 |
LocalsystemWorkeroct26th | Online | v4.0.0.8 | 51 seconds ago | 0 | 0 |
NTP_DEMO_Sanity-ea1118ad | Online | v4.0.0.10 | 38 seconds ago | 3 | 0 |
The warning states that a removed worker has 10 active jobs assigned to it. These jobs will not run until you assign them to an available worker. Open each affected job, select an online worker that can reach the required target network, save the job, and then run or wait for the job according to its schedule.
The two offline workers also show blocked jobs. If you expect the workers to be online, review the worker service, network connectivity, and task-queue configuration. If you intentionally retired the workers, reassign their jobs before removing the worker registrations.
10. Credential health
The Credential health intelligence summarizes the condition of credentials referenced by active discovery jobs. Use this to identify credentials associated with authentication failures and credentials that are inactive or deleted but are still referenced by active jobs.
The indicator in the upper-right corner shows how many credentials require attention. The total below the summary represents the credentials used by active jobs.
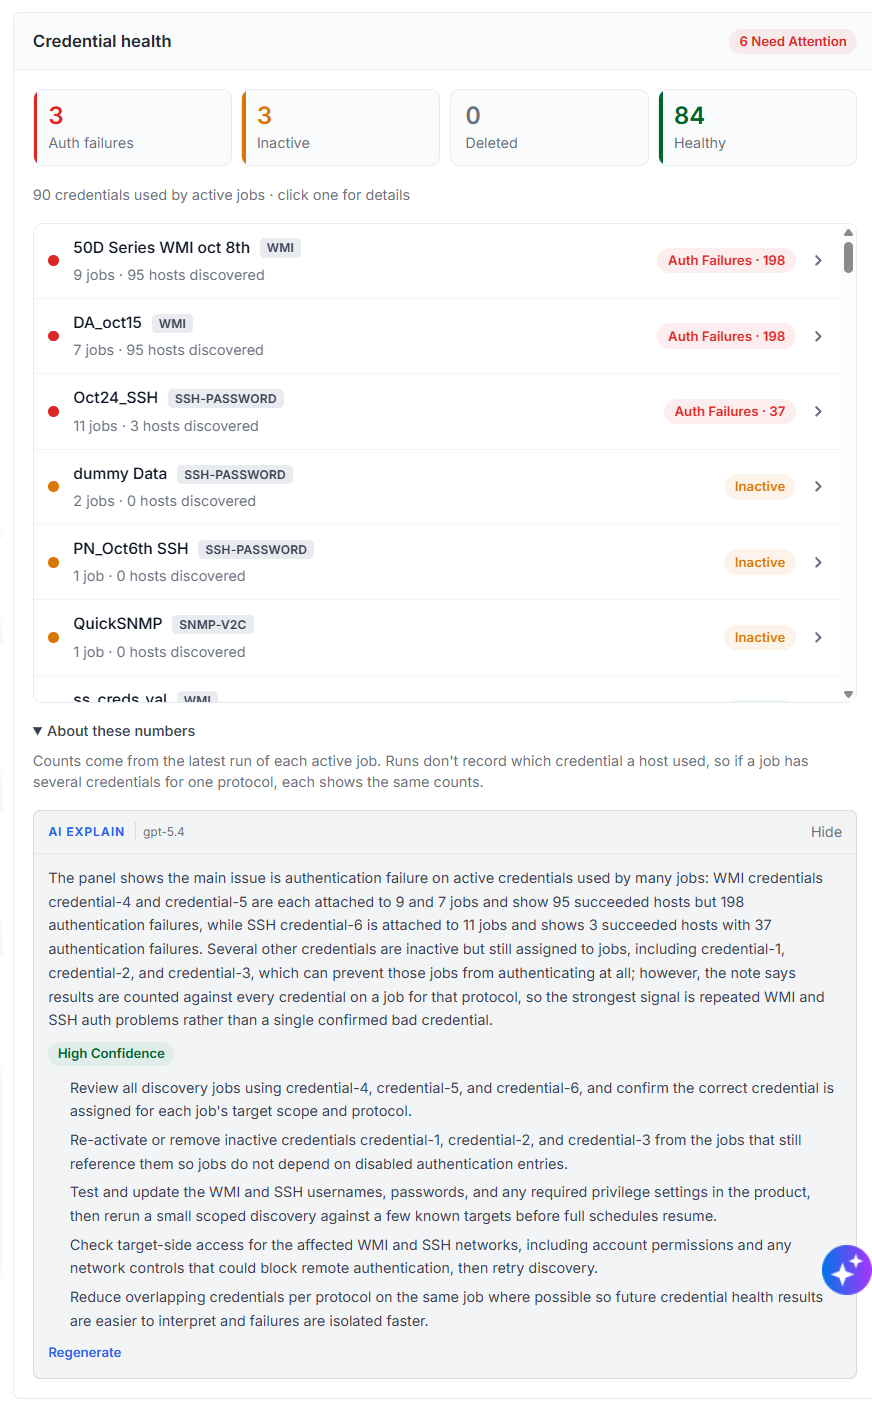
Figure: Credential Health
Status | Description |
|---|---|
Auth failures | Active credentials associated with authentication failures in the latest run of one or more active jobs. Review the username, password, key, community string, permissions, and target-side access requirements. |
Inactive | Credentials that an administrator disabled but that active jobs still reference. Jobs cannot use an inactive credential until an administrator reactivates or replaces it. |
Deleted | Credentials that an administrator deleted but that active jobs still reference. Update the affected jobs to use an available credential. |
Healthy | Active credentials for which the latest available job-run data shows no authentication failure. A healthy status does not confirm that every target was successfully discovered. |
Each credential entry shows the credential name, protocol or credential type, number of active jobs using the credential, number of hosts discovered, and current health status. Select a credential to review its details and the jobs that use it.
The latest run of each active job provides these counts. Discovery runs do not record which credential authenticated to an individual host. If a job contains many credentials for the same protocol, the same discovery and failure counts can appear against each credential. Treat these counts as a guide for where to investigate, not as proof that a specific credential caused every reported failure.
AI explanation
Select What does this mean? in the AI Explain section to generate an explanation of the credential-health results. The generated explanation summarizes the significant authentication and credential-status issues, displays a confidence level, and recommends corrective actions based on the available job-run data.
After generating the explanation, select Hide to collapse it or Regenerate to create updated guidance.
Review the generated guidance before changing credentials or job configurations. Recommended actions can include verifying credentials against a small set of known targets, checking account permissions and network controls, replacing inactive credentials, and reducing overlapping credentials for the same protocol.
10.1 Credential health example
In the example shown, active discovery jobs use 90 credentials. Of these, 3 have authentication failures, 3 are inactive, 0 have deletion status, and 84 are healthy. As a result, 6 credentials need attention.
The affected credentials include two WMI credentials with 198 authentication failures each and one SSH password credential with 37 authentication failures. The list also includes inactive WMI, SSH password, and SNMP v2c credentials that are still assigned to active jobs.
Because the counts come from the latest run of each active job and can repeat when a job uses many credentials of the same protocol, first open the affected credential and review all jobs that reference it. Confirm that each job uses the correct credential for its target scope and protocol. Then test the account against a small number of known targets before the full discovery schedule resumes.
For WMI credentials, verify the username, password, remote WMI permissions, DCOM access, and required Windows firewall rules. For SSH credentials, verify the username, password or private key, privilege requirements, and SSH access on port 22. For SNMP v2c credentials, verify the community string, target access restrictions, and UDP port 161 connectivity.
For an inactive credential, either reactivate it if still valid or replace it in every active job that references it. For a deleted credential, assign an available credential to the affected jobs. After correcting the configuration, rerun a small scoped discovery and review the latest credential-health results.
11. Summary
The Discovery summary section provides a consolidated overview of discovery health, failures, job-run performance, inventory growth, and the primary collection method. Use this section to quickly identify the most significant discovery issue before reviewing the detailed dashboard cards.
The system computes the summary from the current dashboard data. The Computed indicator shows that the system generates the displayed text from live metrics rather than AI.

Figure: Discovery Summary
The computed summary can include the following information:
Information | Description |
|---|---|
Discovery health | Shows the percentage and number of scanned devices that completed discovery without errors. |
Device failures | Shows the total number of failed devices and the number of jobs in which those failures occurred. |
Primary failure cause | Identifies the failure category affecting the largest number of devices and the jobs contributing most to that category. |
Potential recovery | Estimates the proportion of current failures users could resolve by addressing the most common failure cause. |
Next-largest failure cause | Identifies the second most significant failure category and its share of the total failures. |
Job with the highest failure rate | Identifies the job with the highest proportion of failed targets. |
30-day job-run activity | Shows the number of job runs, failed runs, and fully completed run percentage during the last 30 days. |
Inventory activity | Shows the current inventory size and the number of devices discovered today. |
Primary collection method | Identifies the protocol or integration responsible for the largest share of the discovered inventory. |
The summary highlights relationships between dashboard metrics. For example, it can identify whether a large proportion of device failures comes from one failure cause or a small group of discovery jobs. Use the detailed sections of the dashboard to confirm the summary and investigate the affected jobs, devices, workers, credentials, or schedules.
11.1 Available actions
Action | Description |
|---|---|
Export Report | Exports the discovery dashboard report for offline review or sharing. |
Generate AI Summary | Generates an AI-written analysis of the current discovery data. The generated summary can explain significant patterns and recommend areas for investigation. |
Ask AI a Question | Opens an AI-assisted question interface for asking questions about the discovery data. |
The computed summary and AI-generated summary serve different purposes. The computed summary presents a fixed overview based directly on current metrics. Generate AI Summary produces a contextual interpretation only after the user selects the action.
Review AI-generated content before changing discovery job configurations, credentials, worker assignments, schedules, or network settings.
11.2 Example
In the example shown, the discovery health is 100%, with 1,723 of 1,725 scanned devices discovered without errors. The latest job runs contain 327,747 failed devices across 187 jobs.
The primary failure cause, Failed - No Per-host Detail, accounts for 316,939 device failures. The summary identifies CIDR16-Dev-131 Parallel-2, CIDR16-Dev-131 Parallel-3, CIDR16-Dev-131, CIDR16-Dev-131 Parallel-1, CIDR16-Dev-131 Parallel-4, and PostgreSQL-QA as the main jobs contributing to this cause. Resolving this single category could address approximately 97% of the current failures.
The next-largest failure cause is SNMP / Network Timeout, which affects 10,254 devices, or approximately 3% of the failures. CIDR16-Dev-131 has the highest reported failure rate, with 100% of 65,534 targets failing.
During the last 30 days, the system recorded 448 job runs, of which 167 failed. The fully completed run rate was 36%.
The discovered inventory contains 1,725 devices, including 1,343 devices discovered today. LDAP is the dominant collection method and accounts for 75% of the inventory.
Use the summary to guide investigation. In this example, first review the jobs associated with Failed - No Per-host Detail because this category represents most current failures. Then review target connectivity and timeout errors associated with SNMP / Network Timeout. Select Generate AI Summary when you need an AI-written interpretation and recommended investigation steps.