The Discovery Device Details page provides a consolidated view of the information collected for an individual discovered device. Use this page to verify the device identity, review its latest availability and collection status, check discovery coverage, and examine the essential hardware, operating system, storage, network, software, service, and virtualization information returned during discovery.
The page opens with the Overview tab selected. The values, cards, sections, and properties displayed on the page can vary depending on the device type, operating system, discovery method, collection protocol, available credentials, and information returned by the device.
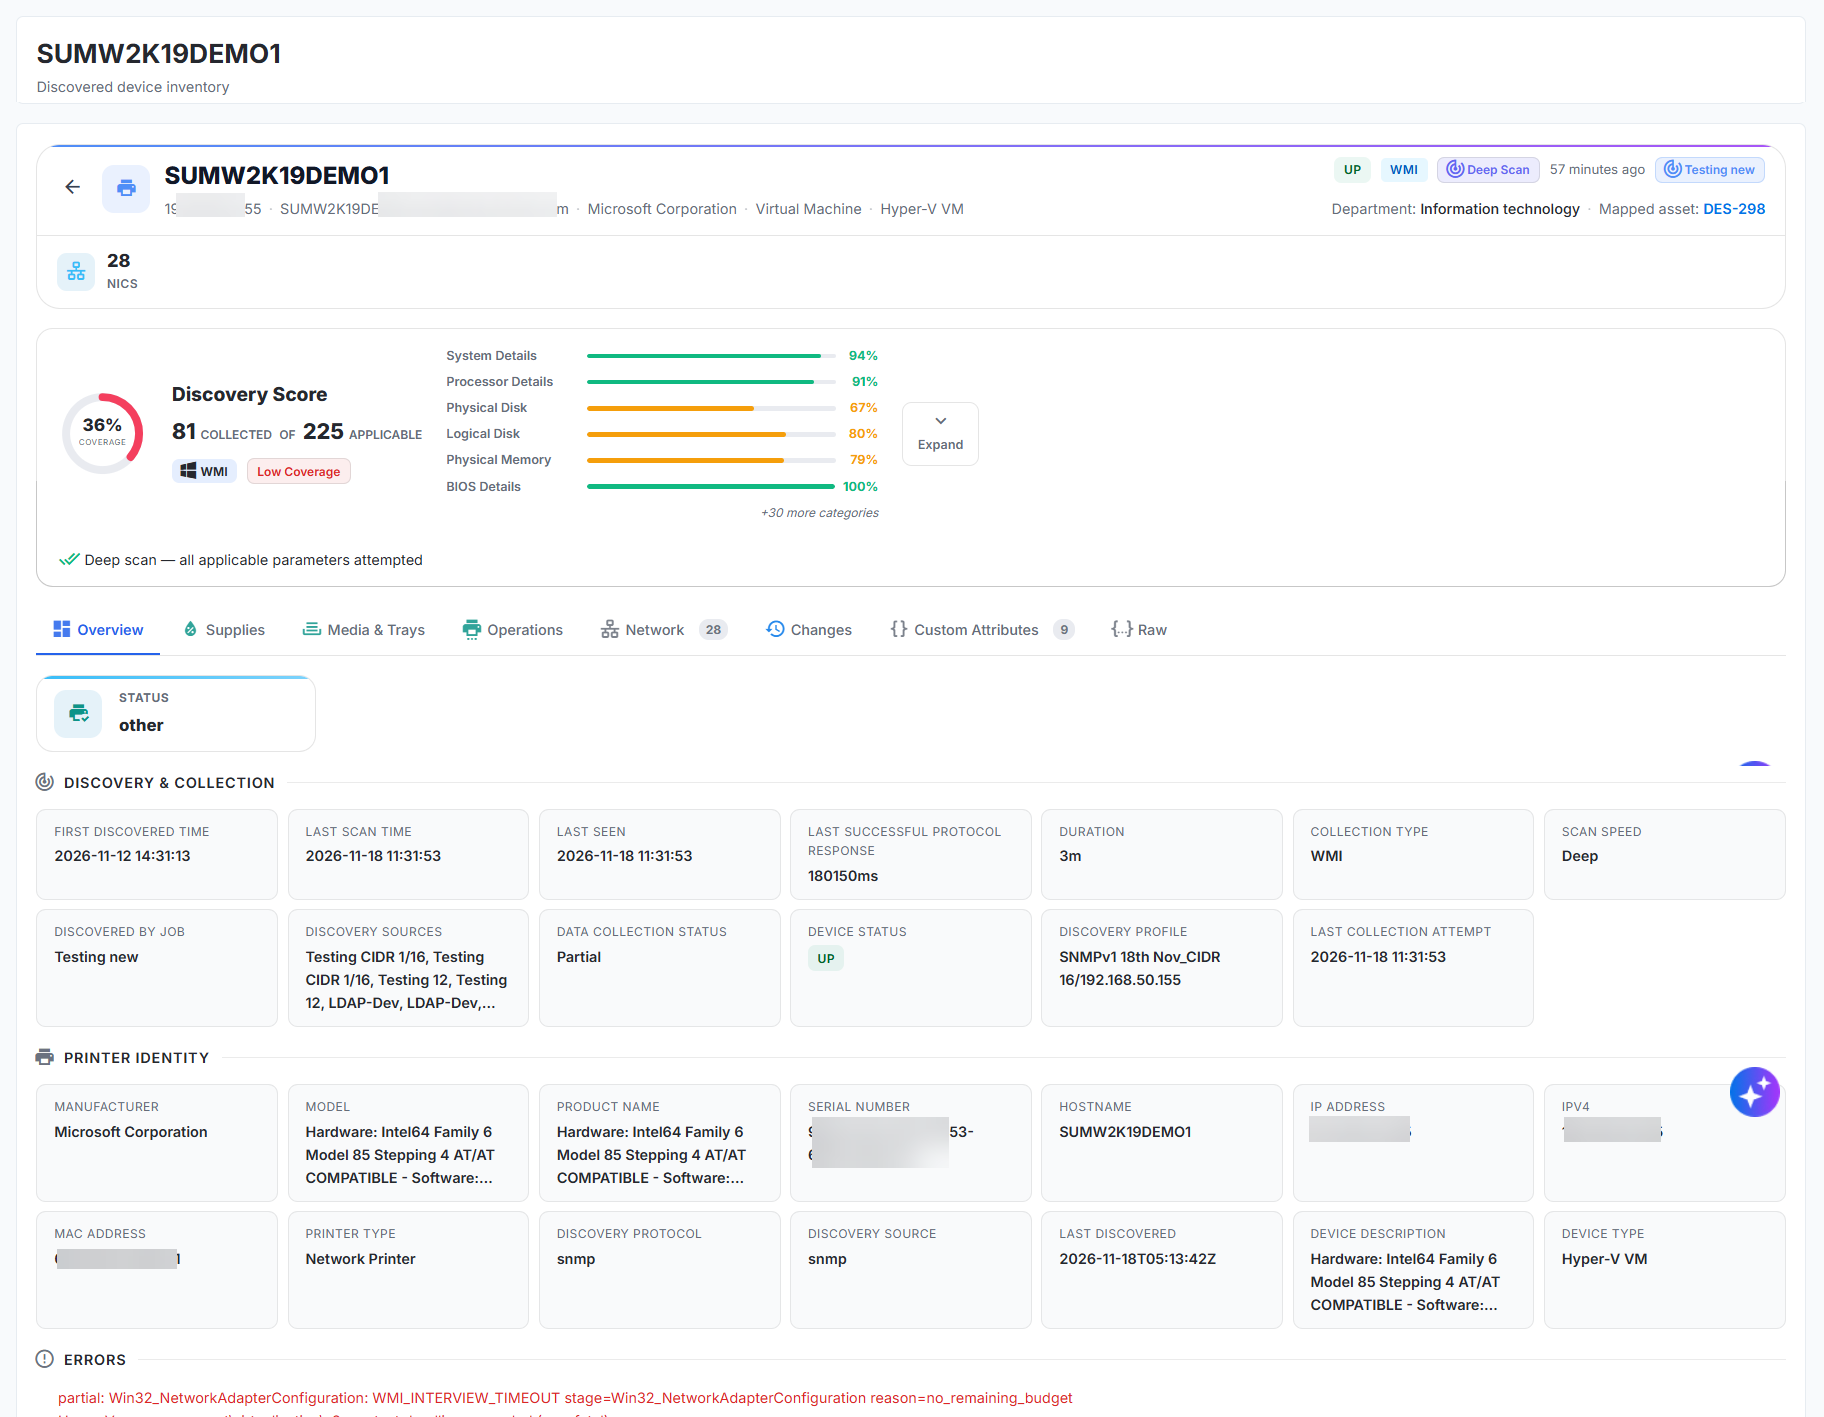
Figure: Discovered Devices
Category-specific Device Header
The device header identifies the selected discovered record, but its details depend on the device category. The identity line can show an IP address, FQDN, manufacturer, model, database engine, or device classification when those values are available. The status and scan badges on the right also vary: a database record can show its database type and database source, while a hypervisor record can show its collection protocol and network scan source.
Header detail | Database example | Hypervisor example |
|---|---|---|
Device name | WIN-L7xxxxxxxM1 | SAIS-Hxx-xxx2 |
Identity line | 1xx.1xx.xxx.xx · SQL Server · Database Server | 1xx.1xx.xx.xx · SAxx-Hxx-xxx2.acme.com · Dell Inc. · PowerEdge R840 · Hypervisor |
Availability | UP | UP |
Category or protocol badge | DATABASE | WMI |
Scan indicator | Deep Scan | Deep Scan |
Scan recency | 6 days ago | 23 hours ago |
Discovery source | QA Database | Network Scan |
These examples show why a single fixed list of header fields does not apply to every device. For example, the database header identifies the SQL Server engine and database classification, while the hypervisor header includes its FQDN, manufacturer, and hardware model. The header displays a field when relevant and available for that device; review other values in the Overview details.
Database Header Example
The table explains the values displayed in the Database header. The device name identifies the discovered record; it may not be the database instance name.
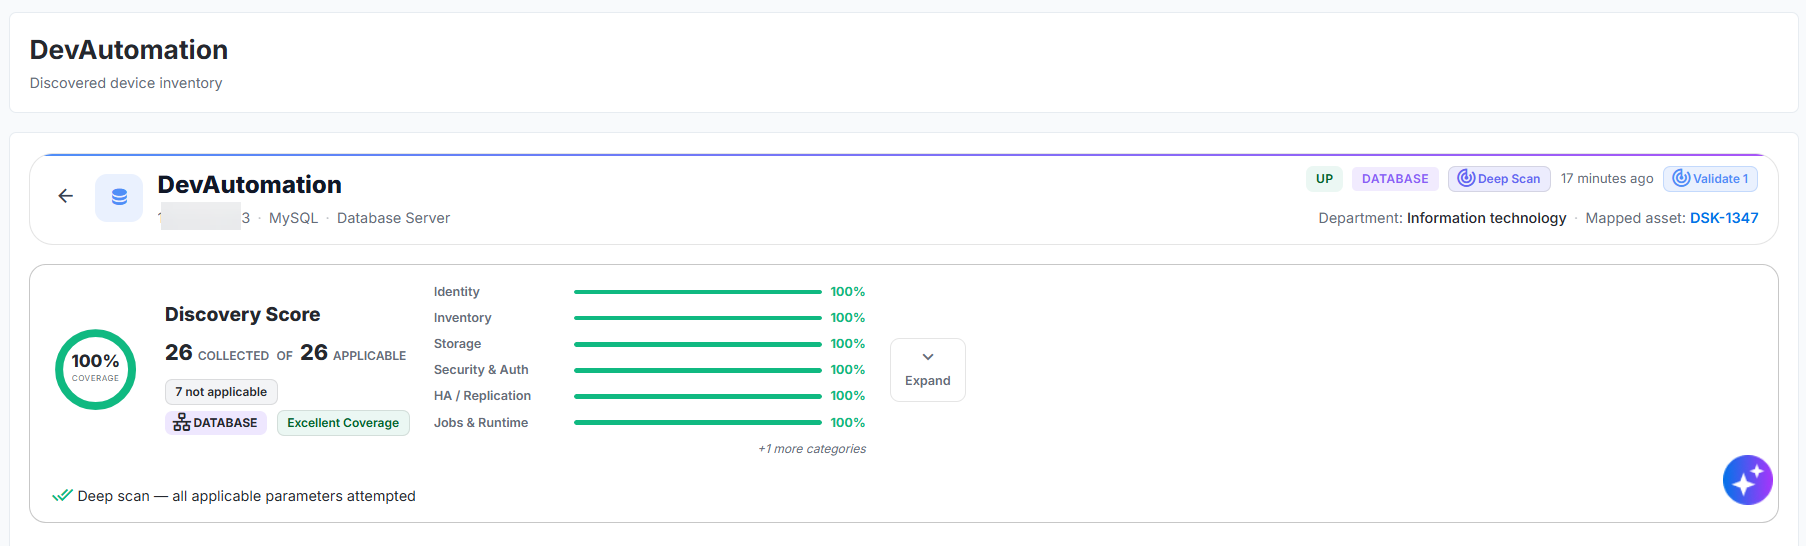
Figure: Database header
Header value | Example | What it tells you |
|---|---|---|
Device name | WIN-LxxxxxxxxM1 | Identifies the selected discovered device record. It can be the host name associated with the database and does not necessarily name the SQL Server instance. |
IP address | 1xx.1xx.1xx.xx | Shows the address collected for the database record during discovery. |
Database engine | SQL Server | Identifies the database technology associated with the discovered record. |
Resource classification | Database Server | Indicates that the system classifies the record as a database server. |
Availability | UP | Shows the latest availability result recorded for this device; this does not guarantee the database is reachable right now. |
Category badge | DATABASE | Identifies the discovered record. This is a category badge, not a collection protocol. |
Scan indicator | Deep Scan | Indicates that the scan collected detailed discovery data for applicable properties. Other two scans include Normal and Fast, based on the option selected during the job configuration the application displays its value. |
Scan recency | 6 days ago | Shows the relative age of the displayed scan. Use exact timestamps in Discovery & Collection to assess freshness. |
Discovery source | QA Database | Shows the source or job label associated with this record. |
Hypervisor Header Example
The table explains the values displayed in the Hypervisor header. Together, the identity fields identify the host and distinguish it from virtual machines that it may host.
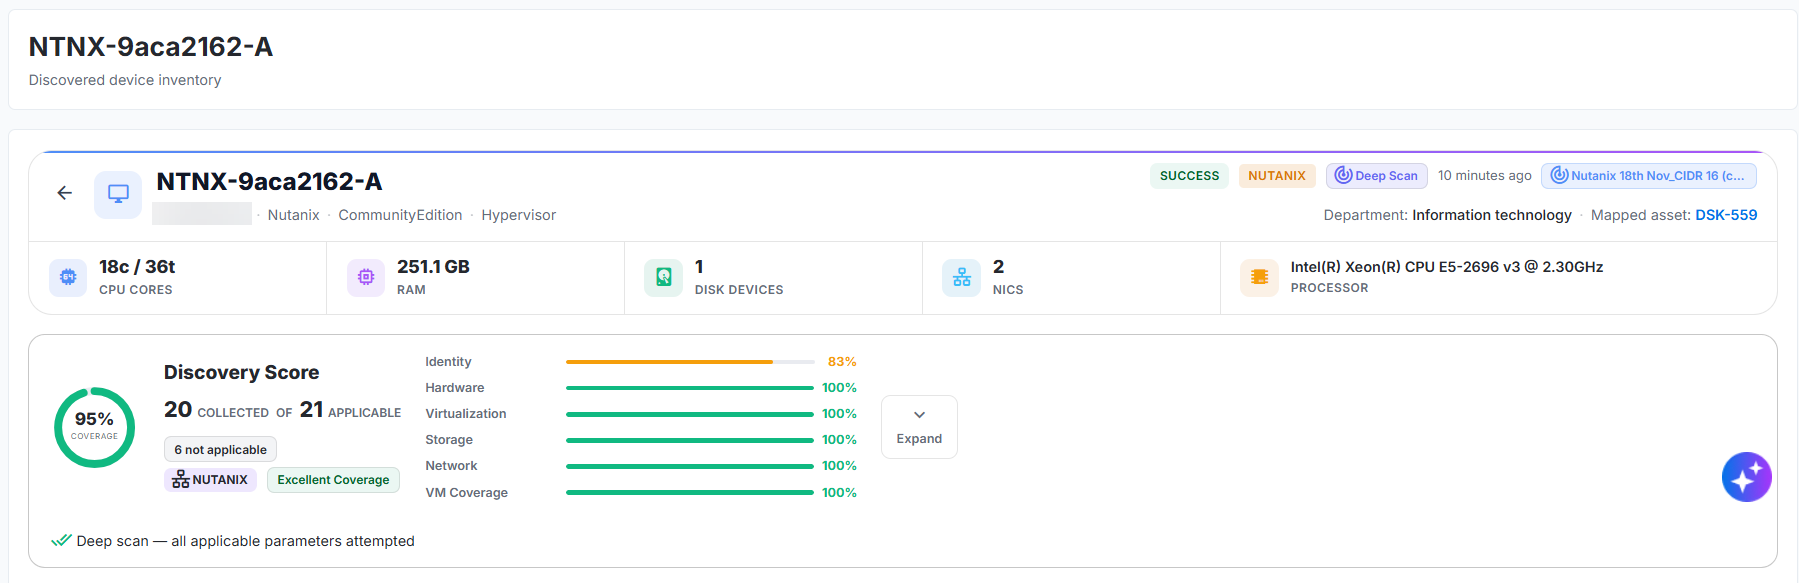
Figure: Hypervisor Header
Header value | Example | What it tells you |
|---|---|---|
Device name | Sxxx-Hxx-xxx2 | Identifies the selected discovered hypervisor host record. |
IP address | 1xx.1xx.xx.xx | Shows the network address collected for the host during discovery. |
FQDN | Sxxx-xxx-xxx2.acme.com | Gives the host’s fully qualified name, which can help distinguish it from devices with similar short names. |
Manufacturer | Dell Inc. | Shows the manufacturer returned for the physical host. |
Model | PowerEdge R840 | Shows the host model returned during discovery. |
Resource classification | Hypervisor | Indicates that this record represents a hypervisor host, not one of its virtual machines. |
Availability | UP | Shows the latest availability result recorded for the host; it does not guarantee that the host is currently accessible. |
Collection protocol | WMI | Identifies Windows Management Instrumentation as the protocol used to collect information. Unlike DATABASE in the database example, this badge identifies a protocol. |
Scan indicator | Deep Scan | Indicates that the scan collected detailed discovery data for applicable properties. Other two scans include Normal and Fast, based on the option selected during the job configuration the application displays its value. |
Scan recency | 23 hours ago | Shows the relative age of the displayed scan. Review Discovery & Collection for exact scan times and collection results. |
Discovery source | Network Scan | Identifies the discovery source or job associated with the host record. |
Compare the Examples
Both headers show a device name, availability, scan type, scan age, and discovery context, but their identity fields and badges differ. The Database header emphasizes the database engine and resource classification. The Hypervisor header provides host-specific identity, including FQDN, manufacturer, and model, and shows WMI as its collection protocol. Use the values available for the selected record rather than expecting every category to display the same fields.
A back arrow appears before the device icon. Select the back arrow to return to the previous page.
Status and Scan Indicators
The indicators on the right side of the device identity header summarize the device’s availability and discovery context. The badge labels depend on category and source; a database record, for example, shows a category badge instead of the protocol badge shown for a hypervisor.
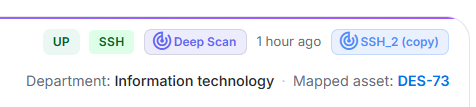
Figure: right-header details
Indicator | Description | Example interpretation |
|---|---|---|
UP | Indicates the latest known availability status of the device. | The device responded to the applicable availability check. |
Category or protocol badge | Identifies the device category or the collection protocol, depending on the record. | DATABASE identifies a database record; WMI identifies Windows Management Instrumentation. |
Deep Scan | Indicates that the scan collected detailed discovery data. | The scan attempted the applicable detailed properties. Other two scans include Normal and Fast, based on the option selected during the job configuration the application displays its value. |
Time since scan | Indicates how much time has elapsed since the displayed scan. | 21 hours ago means the scan result is approximately 21 hours old. |
Discovery source | Identifies the source or job associated with the record. | QA Database for the database example; Network Scan for the hypervisor example. |
Device Configuration Summary
Some device categories show a resource summary cards below the device identity, some can omit based on the category. The values and cards depend on the selected record. In the hypervisor example, the cards summarizes processor cores and threads, RAM, disk devices, NICs, and processor model. The database example instead shows database-oriented cards such as Databases, Storage, Connections, Uptime, and Endpoint lower in the Overview tab.

Figure: Device Configuration
Summary | Description | Example |
|---|---|---|
CPU Cores | Displays the number of processor cores and logical threads when applicable. | 96c / 192t for the hypervisor example. |
RAM | Displays the total discovered memory when applicable. | 1023.5 GB for the hypervisor example. |
Disk Devices | Displays the number of discovered disk devices when applicable. | 2 for the hypervisor example. |
NICs | Displays the number of discovered network interface cards when applicable. | 4 for the hypervisor example. |
Processor | Displays the processor model returned during discovery when applicable. | Intel(R) Xeon(R) Platinum 8163 CPU @ 2.50GHz for the hypervisor example. |
Discovery Score
The Discovery Score measures the completeness of the information collected for the device. The score compares the number of applicable properties for which discovery obtained values with the total number of properties considered applicable to the device.
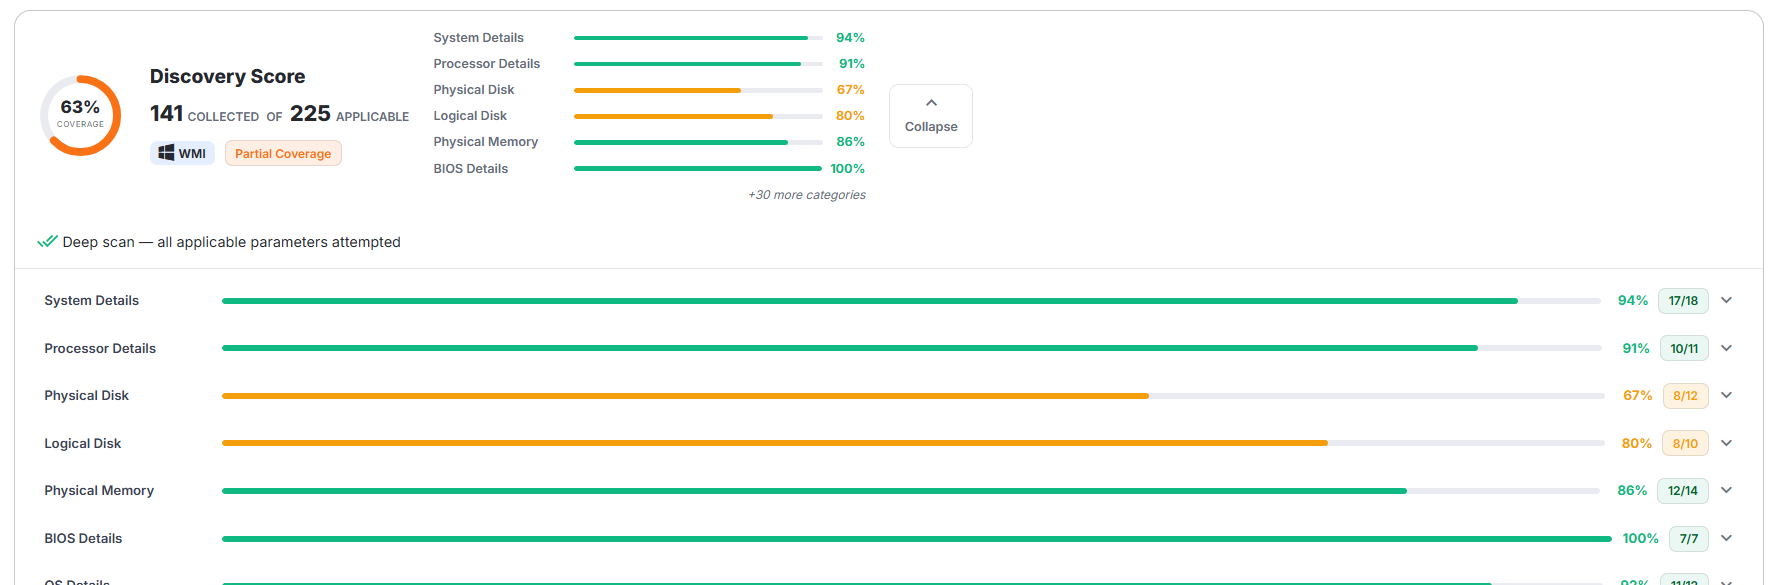
Figure: Discovery Score
For the example device, the Discovery Score displays:
Coverage: 63%
Collected properties: 141
Applicable properties: 225
Collection protocol: WMI
Coverage status: Partial Coverage
Calculate the score as follows:
Discovery Score = Collected properties / Applicable properties × 100

For the example device:

141 / 225 × 100 = 62.67%
System rounds the result and displays as 63%.
Collected Properties
Collected represents the number of applicable properties for which discovery obtained a value.
Example: 141 Collected
The value 141 adds the collected-property counts across all discovery categories in the expanded Discovery Score. It counts properties for which discovery obtained a value.
Applicable Properties
Select Expand in the Discovery Score section to view all applicable property categories. Each category displays its coverage percentage and the number of collected properties compared with the number of applicable properties.
Consider the following example from a Network Device:
Category | Collected | Applicable | Coverage |
|---|---|---|---|
System Details | 17 | 18 | 94% |
Processor Details | 10 | 11 | 91% |
Physical Disk | 8 | 12 | 67% |
Logical Disk | 8 | 10 | 80% |
Physical Memory | 12 | 14 | 86% |
BIOS Details | 7 | 7 | 100% |
OS Details | 11 | 12 | 92% |
Windows Activation | 6 | 8 | 75% |
Network | 11 | 18 | 61% |
Installed Software | 7 | 13 | 54% |
OS Patches | 3 | 3 | 100% |
Security (AV / Firewall) | 0 | 5 | 0% |
Services | 6 | 6 | 100% |
Processes | 6 | 8 | 75% |
User Accounts | 6 | 7 | 86% |
Shared Folders | 0 | 4 | 0% |
Environment Variables | 3 | 3 | 100% |
Scheduled Jobs | 1 | 1 | 100% |
System Restore | 0 | 7 | 0% |
Multimedia - Sound Device | 0 | 3 | 0% |
Multimedia - Video Controller | 1 | 2 | 50% |
Peripherals - Keyboard | 3 | 4 | 75% |
Peripherals - Monitor | 0 | 10 | 0% |
Peripherals - Bluetooth | 0 | 1 | 0% |
Peripheral - Pointing Device | 4 | 6 | 67% |
Peripheral - CD Drive | 5 | 5 | 100% |
Peripheral - POTS Modem | 0 | 1 | 0% |
Peripheral - USB Controller | 0 | 1 | 0% |
Peripheral - Port Connector | 0 | 1 | 0% |
Peripheral - OnBoard Device | 0 | 1 | 0% |
Peripheral - SerialPort | 0 | 1 | 0% |
Peripheral - Infrared Device | 0 | 1 | 0% |
Peripheral - Tape Drive | 0 | 1 | 0% |
Peripheral - Printers | 5 | 9 | 56% |
Other categories not included in the provided list | 1 | 5 | 20% |
Total | 141 | 225 | 63% |
Partial Coverage
The Partial Coverage label indicates that discovery collected some, but not all, of the applicable properties.
Partial Coverage does not mean that the complete collection operation failed. In the example, the Data Collection Status is Success, while the Discovery Score is 63%. This means that the collection operation completed, but some applicable properties did not return values.
A property might be unavailable because of the following reasons:
The device returned a blank value.
The operating system did not populate the source property.
The associated component was not installed or configured.
The collection protocol could not retrieve the property.
The collection account did not have enough access.
A request timed out or did not receive a usable response.
The source provider did not expose the property for the device.
Use the expanded Discovery Score view to identify the categories and individual properties responsible for partial coverage.
Discovery Category Summary
The compact Discovery Score view displays selected discovery categories. Each category includes a progress bar and a coverage percentage.
Category | Coverage | Interpretation |
|---|---|---|
System Details | 94% | Discovery collected most applicable system properties. |
Processor Details | 91% | Discovery collected most applicable processor properties. |
Physical Disk | 67% | Discovery did not collect some applicable physical-disk properties. |
Logical Disk | 80% | Discovery collected most applicable logical-disk properties. |
Physical Memory | 86% | Discovery collected most applicable physical-memory properties. |
BIOS Details | 100% | Discovery collected all applicable BIOS properties. |
The text +30 more categories indicates that the compact view hides other discovery categories.
To learn more about Category properties and attributes, refer to Categories.
Tabs by Category and Discovery Method
The tabs on the Discovery Device Details page vary based on the selected device category and the discovery method. For the Network category, the available tabs also depend on whether discovery used WMI, SSH, or SNMP.
Note: The tabs and the information vary by technology and discovery method.
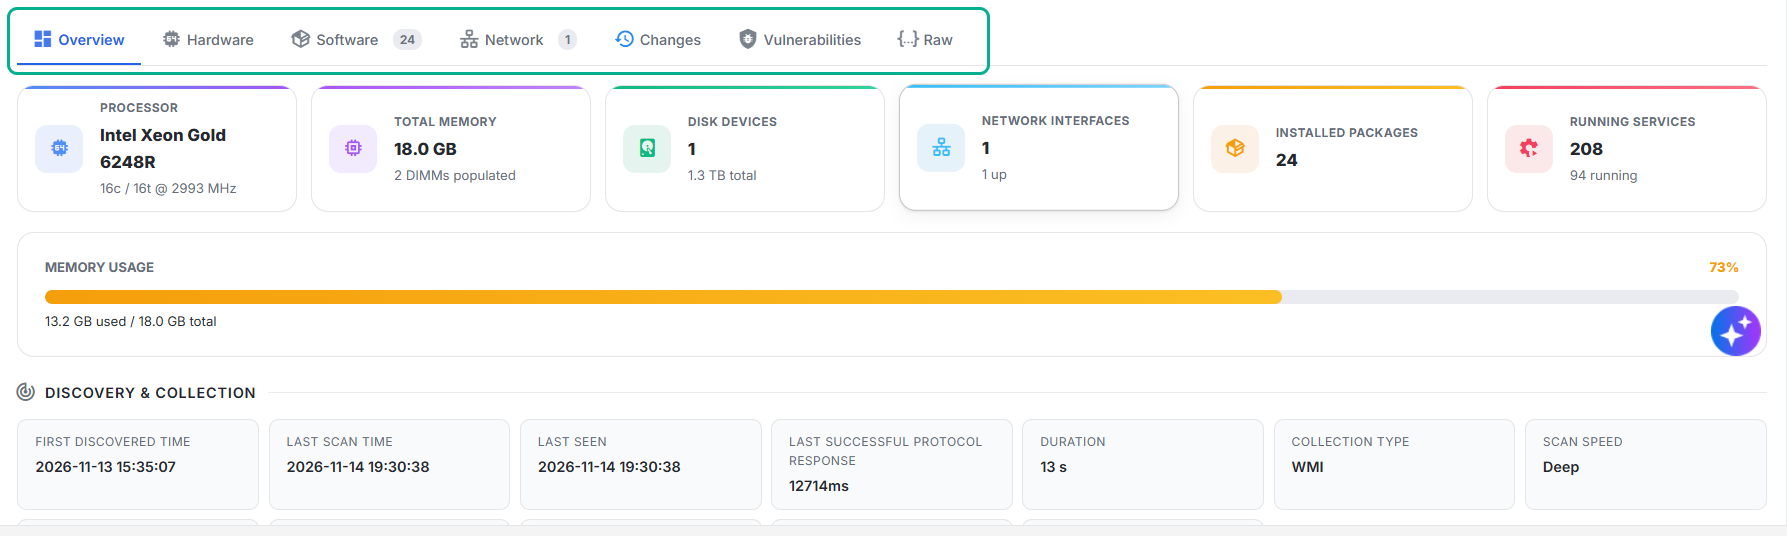
Figure: Tabs by Category
Network
The following tabs contain details about devices in the Network category:
Discovery Method | Available Tabs |
|---|---|
WMI | Overview, Hardware, Changes, Vulnerabilities, Raw |
SSH | Overview, Hardware, Software, Network, Changes, Vulnerabilities, Raw |
SNMP | Overview, , Fabric & Ports, Firmware, Network, Changes, Vulnerabilities, Raw |
LDAP
The following tabs contain details about devices in the Active Directory category:
Discovery Method | Available Tabs |
|---|---|
Active Directory | Overview, Active Directory, Changes, Custom Attributes, Vulnerabilities, Raw |
Note: Custom Attributes appear when defined in the Discovery Extensions and you run an AD job.
Cloud
Cloud tabs vary based on the Type such as Backup Vault, Subnet, Firewall,Private IP, Restore Point Collection, Key Vault, Network Security Group, Public IP Virtual Network, VM, Log Analytics, Managed Disk etc.
General consideration of cloud tabs contain the below:
Discovery Method | Available Tabs |
|---|---|
AWS | Overview, Compute, Storage, Network, Security, Tags, Relationships |
Azure | Configuration, Relationships, Changes, Raw |
OCI | Configuration, Relationships, Changes, Raw |
Container
The following tabs contain details about devices in the Container category:
Discovery Method | Available Tabs |
|---|---|
Docker | Overview, Docker Engine, Containers, Images, Networks, Volumes, Changes, Vulnerabilities, Raw |
Kubernetes | Overview, Cluster Overview, Nodes and Capacity, Namespace, Workloads, Pods & Containers, Networking, Storage, RBAC & Security, Relationships, Changes, Vulnerabilities, Raw |
Hypervisor
The following tabs contain details about devices in the Hypervisor category:
Category | Available Tabs |
|---|---|
Hyper-v | Overview, Supplies, Media & Trays, Operations, Network, Virtual Machines, Changes, Raw |
Nutanix | Overview, Hardware, Network, Storage, Virtual Machines, Changes, Vulnerabilities, Raw |
Database
The following tabs contain details about devices in the Database category:
Category | Available Tabs |
|---|---|
SQL Server | Overview, Databases, Operations, Configuration, Changes, Raw |
MySQL | Overview, Databases, Operations, Configuration, Changes, Raw |
Postgre SQL | Overview, Databases, Operations, Configuration, Changes, Raw |
Overview
The Overview tab provides a consolidated summary of the selected discovered device. The information displayed varies based on the selected category, discovery method, device type, and the properties returned during discovery.
The Overview tab can contain the following sections:
Device Summary
Memory Usage, when applicable
Discovery & Collection
System Information or Instance Identity
Errors, when applicable
Device Summary
The fields displayed in the Device Summary vary based on the category and discovery method.
WMI, SSH, and Hypervisor Devices
For devices discovered through WMI or SSH and for hypervisors, the summary cards can display the following information:
Field | Description |
|---|---|
Processor | Processor model, number of cores and threads, and processor clock speed. |
Total Memory | Total memory and the number of populated memory modules. |
Disk Devices | Number of detected disk devices and their combined capacity. |
Network Interfaces | Number of detected network interfaces and the number currently active. |
Installed Packages | Number of software packages detected on the device. |
Running Services | Total number of detected services and the number currently running. |
A field displays - when the corresponding information was not collected or is unavailable.
SNMP Devices
For devices discovered through SNMP, the summary cards display network-device-specific information.
Field | Description |
|---|---|
Stack Members | Number of devices operating as members of the network stack. The card can also identify the master stack member. |
Interfaces | Total number of interfaces detected on the device and the number currently up. |
Memory | Total memory detected on the device and the percentage currently in use. |
Neighbors | Number of neighboring devices detected through protocols such as CDP or LLDP. |
Power Supplies | Number of power supply units detected on the device. |
Database Instances
For database instances, the summary cards display database usage, availability, and connection information.
Field | Description |
|---|---|
Users | Number of users detected for the database instance. |
Connections | Number of active database connections. The card can also display the maximum number of connections supported by the instance. |
Uptime | Length of time for which the database instance has been running. |
Endpoint | Network address and port used to connect to the database instance. |
Note
The Device Summary fields depend on the selected category and the information returned during discovery. The Device Summary might omit a field when the corresponding information is unavailable or not applicable.
Memory Usage
The Memory Usage section displays the amount and percentage of memory currently in use.
Information | Description |
|---|---|
Usage Percentage | Percentage of total memory currently in use. |
Used Memory | Amount of memory the device is currently using. |
Total Memory | Total memory reported for the device. |
Usage Bar | Visual representation of used memory relative to total memory. |
The Memory Usage section applies to WMI-, SSH-, and SNMP-discovered devices and hypervisors when memory information is available. This section is not displayed in the database Overview shown here.
Discovery & Collection
The Discovery & Collection section provides information about when and how discovery found the device or database instance and when the scan ran. Most fields in this section are common across all categories and discovery methods.
Field | Description |
|---|---|
First Discovered Time | Date and time when the device or database instance was first discovered. |
Last Scan Time | Date and time when the most recent scan completed. |
Last Seen | Most recent date and time when the system detected the device or database instance. |
Last Successful Protocol Response | Response time recorded for the most recent successful protocol communication. This field appears when applicable. |
Duration | Time taken to complete the latest collection. |
Collection Type | Method used to collect information, such as WMI, SSH, SNMP, or DATABASE. |
Scan Speed | Scan level used for the collection, such as Deep. |
Discovered by Job | Discovery job that discovered the device or database instance. |
Discovery Sources | Discovery jobs or scans associated with the device or database instance. |
Data Collection Status | Status of the latest data collection, such as Success or Partial. |
Device Status | Current availability status, such as UP. |
Last Collection Attempt | Date and time of the most recent collection attempt. |
Discovery Profile | Discovery profile used to scan the device. The section displays this field for SNMP devices. |
Note
The category and discovery method determine which fields appear in the Discovery & Collection section.
System Information
The System Information section displays the identity, operating system, hardware, storage, virtualization, and protocol details collected for WMI-, SSH-, and SNMP-discovered devices and hypervisors.
Field | Description |
|---|---|
Host Name | Host name assigned to the device. |
FQDN | Fully qualified domain name of the device. |
IP Address | IP address associated with the device. |
Domain | Domain to which the device belongs. |
Device Type | Identified category or platform, such as a virtual machine, hypervisor, or switch. |
OS | Operating system, network operating system, or firmware information reported by the device. |
OS Version | Version of the installed operating system, when reported separately. |
Kernel / Build | Operating system kernel version or build number. |
Architecture | System architecture reported by the device. |
Processor Name | Model name of the processor. |
RAM Size | Total memory reported for the device. |
Total Disk Capacity | Combined capacity of the detected disk devices. |
Mounted Filesystem Capacity | Combined capacity of the mounted filesystems. |
Manufacturer | Manufacturer reported for the device. |
Model | Hardware or virtual machine model reported for the device. |
Serial Number | Serial number or equivalent unique identifier of the device. |
Virtual | Indicates whether the device is virtual. |
Hosted On | Hypervisor host that runs the virtual machine. |
Hypervisor Type | Virtualization platform associated with the device. |
Device ID | Unique identifier assigned to the discovered device. |
VM UUID | Universally unique identifier of the virtual machine. |
Hyper-Threading | Indicates whether the device uses hyper-threading. |
Last Boot | Date and time when the device was last started. |
Install Date | Date and time when the operating system installation completed. |
Protocol | Protocol used to collect information from the device, such as WMI, SSH, or SNMP. |
The page displays only properties that apply to the selected device and are available from the discovery method.
Instance Identity
For database instances, the Instance Identity section appears instead of System Information. This section provides the identity, connection, product, and replication details of the selected database instance.
Field | Description |
|---|---|
Instance | Name assigned to the database instance. |
Endpoint | Network address and port used to connect to the database instance. |
IP Address | IP address of the database server or endpoint. |
Technology | Database technology associated with the instance, such as MySQL. |
Vendor | Vendor of the database technology. |
Product | Database product detected for the instance. |
Engine Version | Version of the database engine. |
Edition | Edition and licensing information reported for the database product. |
Port | Network port on which the database instance accepts connections. |
Protocol | Network protocol used by the database instance, such as TCP. |
Replication Role | Role of the database instance in the replication configuration, such as primary. |
Device Type | Identifies the discovered item as a database server. |
Errors
The Errors section appears when discovery can’t collect one or more properties during the scan. The section identifies the collection error and the affected property or data category.
A collection error can result in a Partial data collection status or unavailable values in other sections.
Overview Variations
Category or Discovery Method | Device Summary | Identity Section | Additional Variation |
|---|---|---|---|
WMI | Processor, memory, disks, network interfaces, installed packages, and services | System Information | Displays Windows and WMI-specific information. |
SSH | Processor, memory, disks, network interfaces, installed packages, and services | System Information | Displays Linux or UNIX and SSH-specific information. |
Hypervisor | Processor, memory, disks, network interfaces, installed packages, and services | System Information | Displays hypervisor identity and platform information. |
SNMP | Stack members, interfaces, memory, neighbors, and power supplies | System Information | Displays network-device identity and platform information. |
Database | Users, connections, uptime, and endpoint | Instance Identity | Displays database product, engine, connection, edition, and replication information. |
Hardware
The Hardware tab provides a consolidated view of the physical and virtual hardware components detected on the discovered device. Use this information to review the device configuration, monitor resource usage, verify storage capacity, and identify the hardware components associated with the device.
Important: Hardware sections, fields, and values vary by device technology and discovery method. WMI-, SSH-, or SNMP-discovered devices, virtual machines, and hypervisors can each show different hardware details. If discovery does not return a property, the page may show a hyphen (-), Unknown, or an empty value.
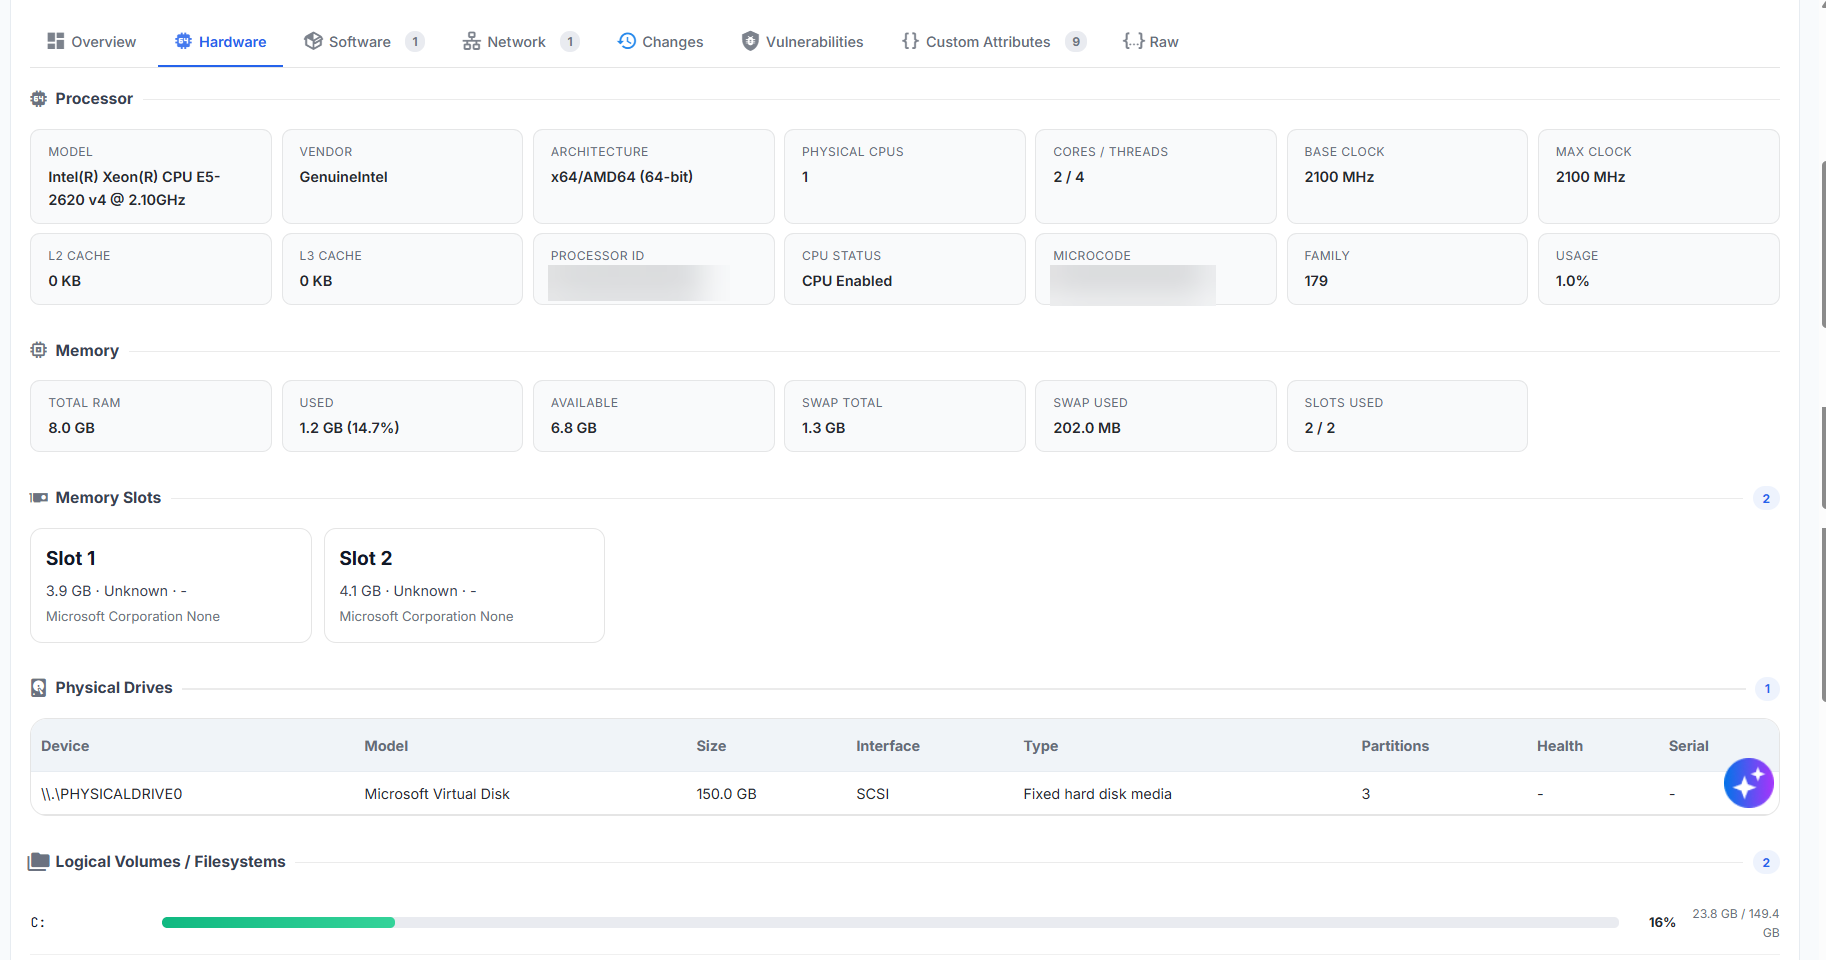
Figure: Hardware
The Hardware tab contains the following sections:
Section | Description |
|---|---|
Processor | Displays processor information, including the model, vendor, architecture, number of physical CPUs, cores and threads, clock speed, cache size, processor ID, CPU status, microcode, processor family, and current usage. |
Memory | Provides an overview of the device memory, including total RAM, used memory, available memory, total swap space, used swap space, and the number of memory slots in use. |
Memory Slots | Displays the memory modules detected in individual slots. Details can include the slot name, module capacity, manufacturer, and other information reported for the installed memory module. |
Physical Drives | Lists the physical storage devices detected on the device. Details can include the device name, model, storage capacity, interface type, media type, number of partitions, health status, and serial number. |
Logical Volumes / Filesystems | Displays the logical volumes and filesystems configured on the device. Storage usage indicators show the used and available capacity for each volume. Additional details can include the volume name, filesystem type, total capacity, free capacity, and volume type. |
GPUs | Lists the graphics processing units and display adapters detected on the device, along with the available driver information. |
Keyboards | Displays the keyboards associated with the device. Details can include the keyboard name, layout, manufacturer, serial number, and operational status. |
Pointing Devices | Lists the pointing devices detected on the device, such as a mouse or remote desktop pointing device. Details can include the device name, type, number of buttons, manufacturer, and operational status. |
BIOS & Baseboard | Provides BIOS, firmware, and baseboard information, including the board manufacturer, product, version, serial number, BIOS vendor, firmware version, BIOS date, and SMBIOS version. |
Note
Hardware information may represent physical components, virtual hardware, or remotely presented devices. For example, a virtual machine may report virtual disks, virtual display adapters, and virtual firmware supplied by the hypervisor.
Understanding Storage Usage
The Logical Volumes / Filesystems section uses storage bars to show the percentage of capacity used for each volume. The accompanying values show the used storage compared with the total storage capacity. Use this information to identify volumes that are approaching their storage limits.
A volume with no reported capacity, such as an empty removable or optical drive, may display 0 B for both total and free space.
Hardware Component Counts
A count displayed beside a section heading indicates the number of components detected in that category. For example, a count of 2 beside Physical Drives indicates that discovery detected two physical drives.
Software
The Software tab provides information about the operating system, installed packages, active processes and services, user accounts, and environment variables discovered on the device. Use this information to review the device’s software configuration, identify installed packages, and inspect active system components.
Important: Software sections and fields vary by device technology and discovery method. Installed packages and running services depend on the collection method and permissions. If discovery does not return a property, the page may show a hyphen (-) or an empty value.
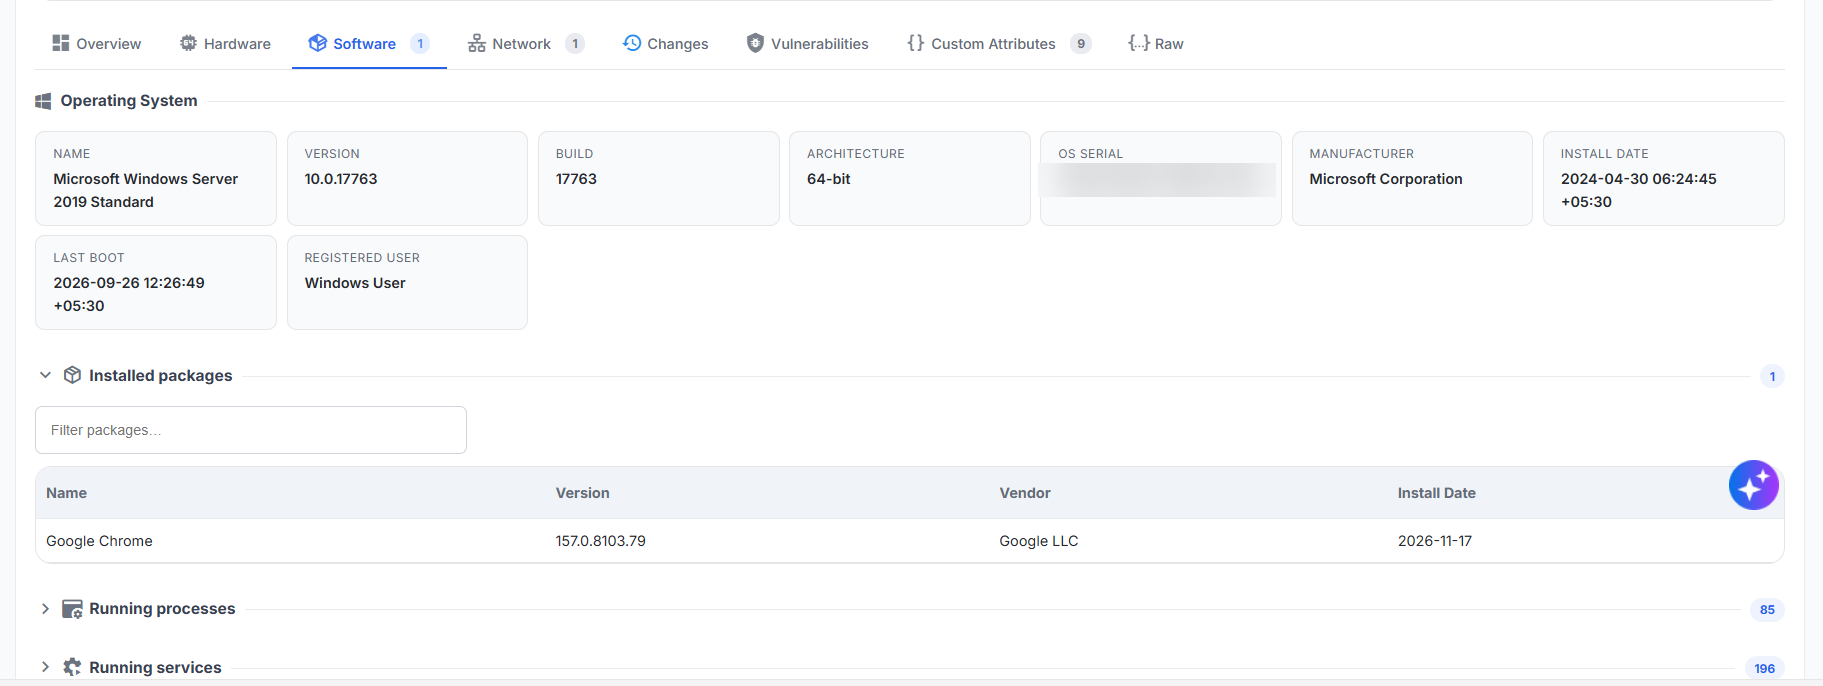
Figure: Software
The Software tab contains the following sections:
Section | Description |
|---|---|
Operating System | Displays general operating system information, including the operating system name, version, kernel version, architecture, and code name. |
Installed packages | Lists the software packages detected on the device, including the package name, version, vendor, and installation date, when available. |
Running processes | Lists the processes that were running on the device when the discovery scan collected the data. |
Running services | Lists the services that were running on the device when the discovery scan collected the data. |
User accounts | Lists the user accounts detected on the device. |
Environment variables | Displays the environment variables collected from the device, including the variable name, scope, and value, when available. |
Select the arrow beside a section to expand or collapse its contents. The count displayed beside a section heading indicates the number of records detected in that category. For example, a count of 1508 beside Installed packages indicates that discovery detected 1,508 packages.
Operating System
The Operating System section displays the following information:
Field | Description |
|---|---|
Name | The name of the operating system installed on the device. |
Version | The operating system release version and its associated release name, when available. |
Kernel | The version of the operating system kernel running on the device. |
Architecture | The processor architecture supported by the operating system, such as x86_64. |
Code Name | The code name associated with the operating system release. |
Installed Packages
The Installed packages section displays the following information for each detected package:
Field | Description |
|---|---|
Name | The name of the installed package. |
Version | The installed version of the package. |
Vendor | The organization or package maintainer associated with the package. |
Install Date | The date on which the operating system installed the package, when reported. |
Use the Filter packages field to locate a package in the list. A hyphen (-) in the Install Date column indicates that the installation date was not reported.
Running Processes
The Running processes section displays the following information for each detected process:
Field | Description |
|---|---|
Name | The name of the running process. |
PID | The process identifier assigned by the operating system. |
Memory | The amount of memory the process used when the system collected the discovery data. |
User | The user account under which the process was running. |
Use the Filter processes field to locate a process in the list. A hyphen (-) in the Memory column indicates that memory usage was not reported for the process.
Running Services
The Running services section displays the services detected on the device and their status at the time of the discovery scan.
Field | Description |
|---|---|
Name | The name of the service. |
State | The operational state of the service, such as active/running, active/exited, or inactive/dead. |
Start Mode | Indicates how the system starts the service, such as enabled or static. |
Path | The filesystem path of the executable, command, or unit associated with the service. |
Use the Filter services field to locate a service in the list.
The service states can include the following values:
State | Description |
|---|---|
active/running | The service is active and has a process that is currently running. |
active/exited | The service completed its configured startup action successfully and remains in an active state without a continuously running process. |
inactive/dead | The service is not currently running. This state does not necessarily mean an error because some services run only when triggered or required. |
The start modes can include the following values:
Start Mode | Description |
|---|---|
enabled | The system starts the service automatically when it reaches the associated system target. |
static | You cannot enable the service directly; the system generally starts it as another service’s dependency or when required. |
User Accounts
The User accounts section lists the user accounts detected on the device.
Field | Description |
|---|---|
Username | The sign-in or account name that identifies the user on the device. |
Full Name | The descriptive name associated with the account. |
Status | Indicates whether the account is active or inactive. |
Domain | The domain associated with the account. A hyphen (-) indicates that discovery did not return domain information. |
A status of Active indicates that the account was active when discovery collected the data.
Note: The displayed accounts can include system accounts, administrative accounts, and standard user accounts. For example, Linux devices commonly include the root system administrator account.
Environment Variables
The Environment variables section displays the environment variables collected from the device.
Field | Description |
|---|---|
Name | The name of the environment variable, such as PATH. |
Value | The value assigned to the environment variable. For variables such as PATH, the value can contain many filesystem locations separated by delimiters. |
Environment variables define values used by the operating system, applications, services, and command-line tools. For example, the PATH variable specifies the directories that the operating system searches when locating executable commands.
Network
The Network tab provides information about the network configuration and network interfaces detected on the discovered device. Use this information to review network connectivity, identify assigned IP addresses, verify interface status, and understand how the device communicates with other devices and services on the network.
Important: Network sections and fields vary by device technology and discovery method. WMI, SSH, and SNMP can return different interface, address, neighbor, and traffic details. If discovery does not return a property, the page may show a hyphen (-) or an empty value.
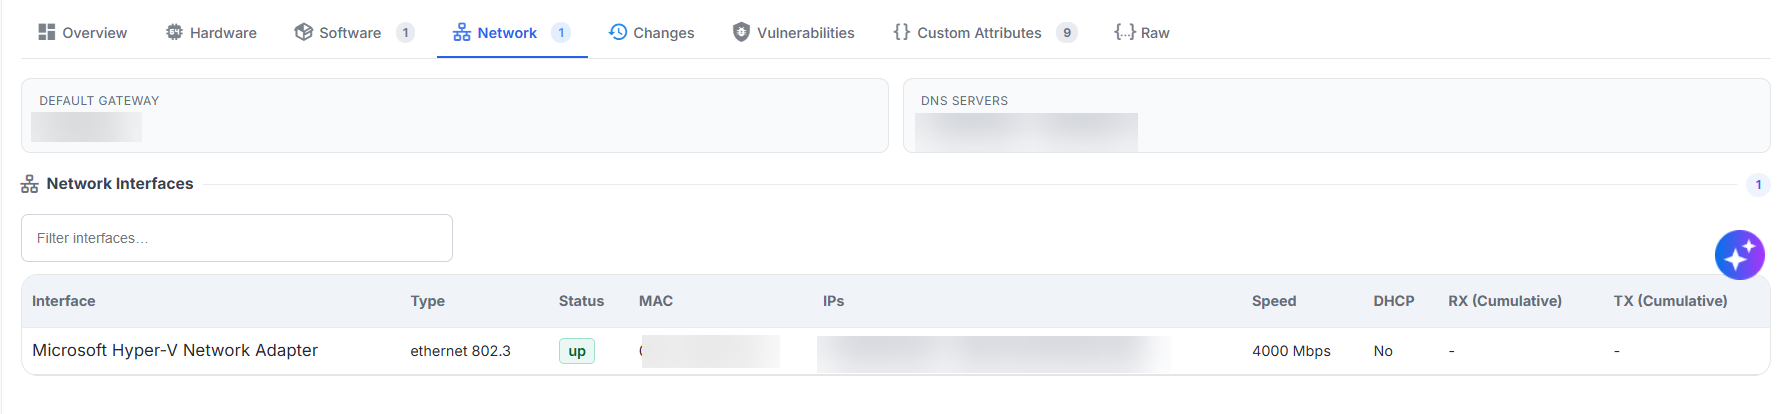
Figure: Network tab
The Network tab contains the following information:
Section | Description |
|---|---|
Default Gateway | Displays the IP address of the network gateway used by the device to communicate with resources outside the local network. |
DNS Servers | Lists the IP addresses of the Domain Name System (DNS) servers configured for the device. DNS servers translate domain names into IP addresses. |
Network Interfaces | Lists the physical and virtual network interfaces detected on the device, along with their configuration, connectivity status, and available traffic details. |
Network Interfaces
The Network Interfaces section displays the following information for each detected interface:
Field | Description |
|---|---|
Interface | The name of the physical or virtual network interface detected on the device. |
Status | The current operational status of the interface, such as up or down. An up status indicates that the interface is active. |
MAC | The Media Access Control (MAC) address assigned to the network interface. The MAC address uniquely identifies the interface within a network. |
IPs | Lists the IPv4 and IPv6 addresses assigned to the interface. An interface can have more than one IP address. |
Speed | The connection speed reported for the interface, displayed in Mbps or another applicable unit. |
DHCP | Indicates whether the interface obtains its network configuration automatically from a Dynamic Host Configuration Protocol (DHCP) server. Yes indicates that the interface uses DHCP, while No indicates that it uses a manually assigned or otherwise configured address. |
RX | Displays the available received network traffic information for the interface. A hyphen (-) indicates that the value was not reported. |
TX | Displays the available transmitted network traffic information for the interface. A hyphen (-) indicates that the value was not reported. |
Use the Filter interfaces field to locate a network interface when the device has many interfaces.
A count displayed beside Network Interfaces indicates the number of interfaces detected on the device. For example, a count of 1 indicates that the system detected one network interface.
Note: The Network tab can include physical network adapters and virtual adapters created by virtualization platforms or other software. For example, a virtual machine hosted on Microsoft Hyper-V may display a Microsoft Hyper-V network adapter.
Note: Link-local IPv6 addresses typically begin with fe80: and support communication within the local network segment. These addresses are not normally used to communicate outside the local network.
Virtual Machines
The Virtual Machines tab provides information about the virtualization platform and the virtual machines hosted on the discovered hypervisor. Use this tab to review the hypervisor configuration, identify hosted virtual machines, monitor their power states, and determine whether the system discovered each virtual machine as a separate device.
Important: This tab applies to supported hypervisor technologies. Its fields, filters, and virtual-machine details vary by platform and discovery method, and depend on the information the host returns during discovery.
The summary displayed at the top of the tab shows the number of running virtual machines and the total number of virtual machines detected on the hypervisor.
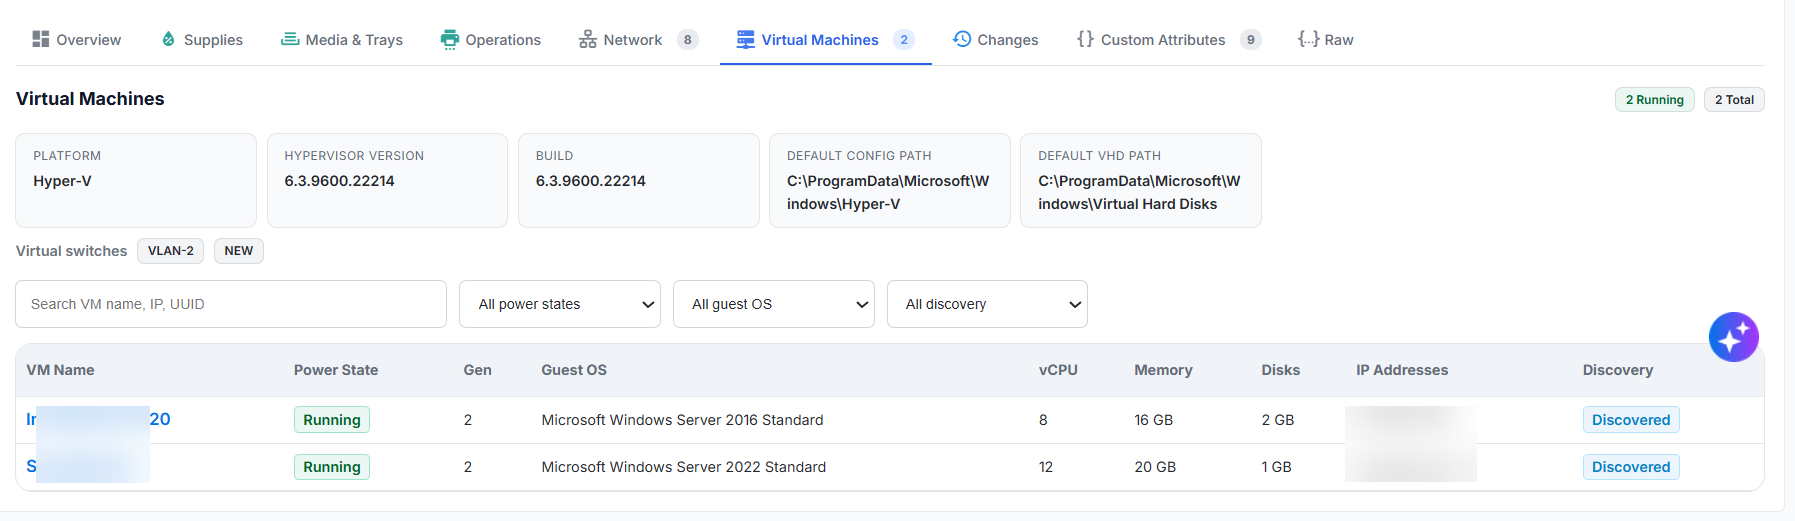
Figure: Virtual Machines Details
The Virtual Machines tab displays the following hypervisor information:
Field | Description |
|---|---|
Platform | The virtualization platform running on the discovered device, such as Hyper-V. |
Hypervisor Version | The version of the hypervisor installed on the host. |
Build | The build number of the installed hypervisor. |
Default Config Path | The default location used to store virtual machine configuration files. |
Default VHD Path | The default location used to store virtual hard disk files. |
Virtual switches | Lists the virtual switches configured on the hypervisor. Virtual switches provide network connectivity between virtual machines and physical or virtual networks. |
Find and Filter Virtual Machines
Use the search field to find a virtual machine by its name, IP address, or UUID.
The following filters are available:
Filter | Description |
|---|---|
Power state | Filters virtual machines according to their current power state, such as running or stopped. |
Guest OS | Filters virtual machines according to the detected guest operating system. |
Discovery | Filters virtual machines according to whether the system discovered them as separate devices. |
Select All power states, All guest OS, or All discovery to remove the corresponding filter and display all matching virtual machines.
Virtual Machine Details
The virtual machine table displays the following information:
Field | Description |
|---|---|
VM Name | The name assigned to the virtual machine. If the system displays the name as a link, select it to open the corresponding discovered-device record. |
Power State | The current operating state of the virtual machine, such as Running or Stopped. |
Gen | The virtual machine generation, such as Generation 1 or Generation 2. |
Guest OS | The operating system detected on the virtual machine. Unknown indicates that the system did not report guest operating system information or could not identify the operating system. |
vCPU | The number of virtual processors allocated to the virtual machine. |
Memory | The amount of memory allocated to the virtual machine. |
Disks | The total virtual disk capacity reported for the virtual machine. |
IP Addresses | Displays an IP address associated with the virtual machine. If more addresses are available, a value such as +1 indicates how many more IP addresses the system detected. Unknown indicates that the system did not detect an IP address. |
Discovery | Indicates whether the system discovered the virtual machine and linked it to a separate device record. |
The Discovery column can display the following values:
Status | Description |
|---|---|
Discovered | The system discovered the virtual machine as a separate device and linked it to a discovered-device record. |
Not Discovered | The system identified the virtual machine on the hypervisor, but has not linked it to a corresponding discovered-device record. |
Databases
The Databases tab lists the databases detected on the discovered database instance. Use this tab to review database ownership, size, operational status, recovery model, and creation date.
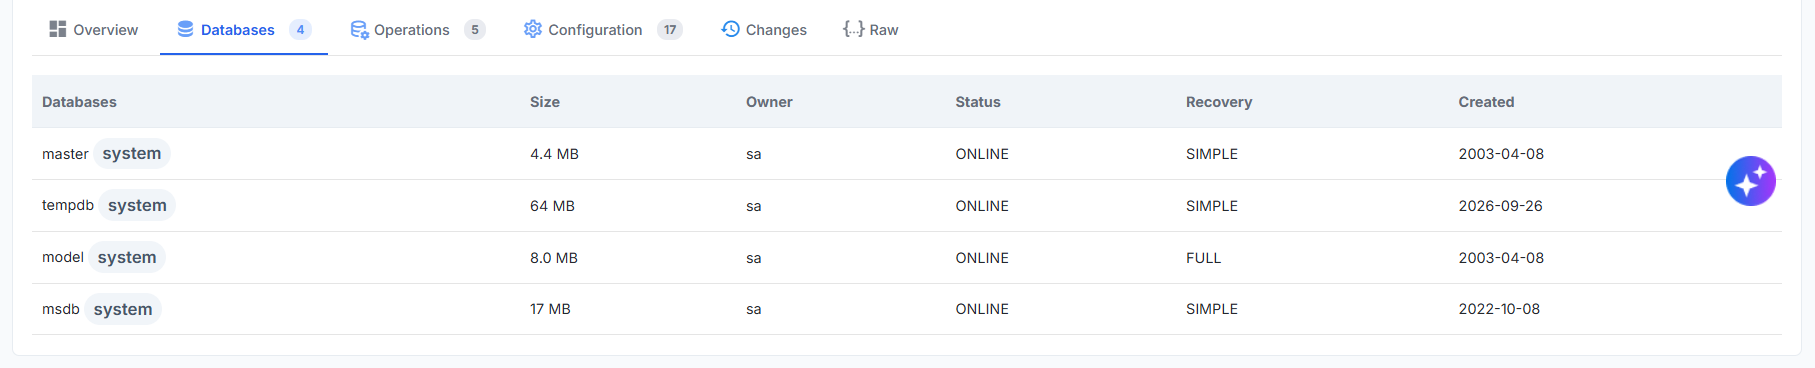
Figure: Databases tab
The number displayed beside the Databases tab indicates the number of databases detected on the instance.
The Databases tab displays the following information:
Field | Description |
|---|---|
Databases | The name of the database. A system label identifies a system database maintained by the database server. |
Size | The reported storage size of the database. |
Owner | The database login or principal that owns the database. |
Status | The current operational state of the database, such as ONLINE. |
Recovery | The recovery model configured for the database, such as SIMPLE or FULL. |
Created | Database creation cate. |
The recovery model determines how database transactions gets logged and affects the supported backup and restore options.
Common recovery models include:
Recovery Model | Description |
|---|---|
SIMPLE | Automatically reuses transaction log space after checkpoints. Point-in-time recovery is not supported. |
FULL | Retains transaction log records until the system performs a log backup. This model supports point-in-time recovery when the required backups are available. |